Journal figures are judged at their placed size, not at the larger scale of a notebook preview. Matplotlib can export the same chart as vector artwork for typesetting and as a 300 DPI raster image for review or submission systems.
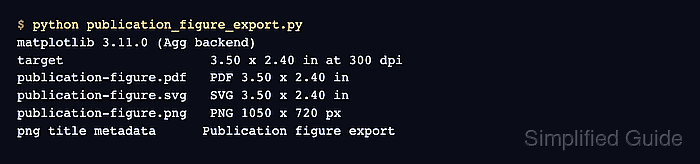
A 3.50 inch by 2.40 inch canvas has fixed physical dimensions in PDF and SVG. Saving the same canvas at 300 DPI produces a 1050 by 720 pixel PNG, so the dimensions can be checked without relying on a viewer's zoom setting.
Typography and layout must be set before the figure is drawn; constrained layout then reserves space for labels, tick text, and the legend. Avoid bbox_inches='tight' when exact page dimensions are mandatory because it recalculates the saved bounding box.
Related: How to set figure size in Matplotlib
Related: How to save a Matplotlib figure
Steps to export a publication-ready Matplotlib figure:
- Create publication_figure_export.py with the output settings and publication typography.
- publication_figure_export.py
from pathlib import Path
import re
import xml.etree.ElementTree as ET

import matplotlib
import matplotlib.pyplot as plt
import numpy as np
from PIL import Image


OUT = Path("exports")
OUT.mkdir(exist_ok=True)

width_in = 3.50
height_in = 2.40
dpi = 300

plt.rcParams.update(
    {
        "font.size": 8,
        "axes.labelsize": 8,
        "axes.titlesize": 9,
        "legend.fontsize": 7,
        "xtick.labelsize": 7,
        "ytick.labelsize": 7,
        "pdf.fonttype": 42,
        "svg.fonttype": "none",
    }
)
pdf.fonttype=42 embeds TrueType text in the PDF. svg.fonttype='none' keeps SVG labels as text, so the receiving system must have a compatible font.
Related: How to configure fonts in Matplotlib - Append the data and figure construction below the rcParams block.
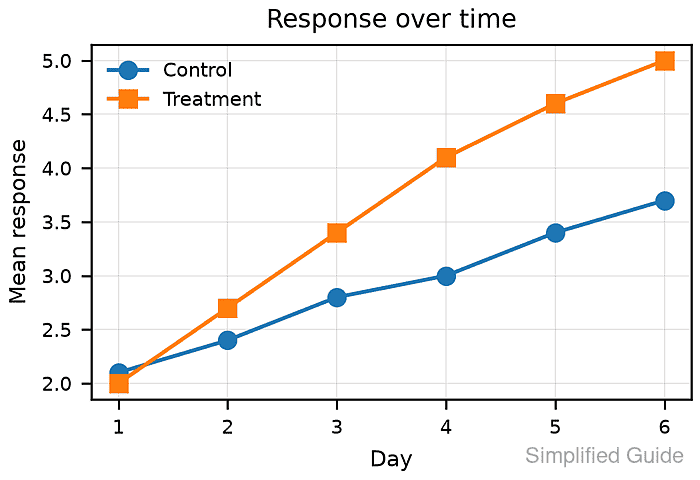
days = np.arange(1, 7)
control = np.array([2.1, 2.4, 2.8, 3.0, 3.4, 3.7])
treatment = np.array([2.0, 2.7, 3.4, 4.1, 4.6, 5.0])

fig, ax = plt.subplots(figsize=(width_in, height_in), layout="constrained")
ax.plot(days, control, marker="o", linewidth=1.4, label="Control")
ax.plot(days, treatment, marker="s", linewidth=1.4, label="Treatment")
ax.set_title("Response over time")
ax.set_xlabel("Day")
ax.set_ylabel("Mean response")
ax.grid(True, linewidth=0.4, alpha=0.35)
ax.legend(frameon=False)
Constrained layout allocates room inside the fixed canvas for the title, labels, ticks, and legend.
Related: How to fix overlapping labels in Matplotlib - Append the vector and raster export block below the legend call.
metadata = {
    "Title": "Publication figure export",
    "Author": "Data Team",
    "Creator": "Matplotlib publication export script",
}

pdf = OUT / "publication-figure.pdf"
svg = OUT / "publication-figure.svg"
png = OUT / "publication-figure.png"

fig.savefig(pdf, metadata=metadata)
fig.savefig(svg, metadata={"Title": metadata["Title"], "Creator": metadata["Creator"]})
fig.savefig(png, dpi=dpi, metadata={"Title": metadata["Title"]})
plt.close(fig)
savefig() infers each format from its filename. The DPI value controls the raster dimensions and any rasterized artists inside vector output.
- Append the PDF and SVG size readers below the export block.
def pdf_size_inches(path):
    match = re.search(
        rb"/MediaBox\s*\[\s*0\s+0\s+([0-9.]+)\s+([0-9.]+)\s*\]",
        path.read_bytes(),
    )
    if not match:
        raise RuntimeError(f"MediaBox not found in {path}")
    return float(match.group(1)) / 72, float(match.group(2)) / 72


def svg_unit_to_inches(value):
    if value.endswith("pt"):
        return float(value[:-2]) / 72
    if value.endswith("in"):
        return float(value[:-2])
    raise RuntimeError(f"Unsupported SVG unit: {value}")


def svg_size_inches(path):
    root = ET.parse(path).getroot()
    return svg_unit_to_inches(root.attrib["width"]), svg_unit_to_inches(
        root.attrib["height"]
    )
- Complete publication_figure_export.py with the file checks and dimension report.
pdf_size = pdf_size_inches(pdf)
svg_size = svg_size_inches(svg)

with Image.open(png) as image:
    png_size = image.size
    png_title = image.text.get("Title", "")

expected_inches = (width_in, height_in)
expected_pixels = (round(width_in * dpi), round(height_in * dpi))

if not np.allclose(pdf_size, expected_inches, atol=0.01):
    raise RuntimeError(f"unexpected PDF size: {pdf_size}")
if not np.allclose(svg_size, expected_inches, atol=0.01):
    raise RuntimeError(f"unexpected SVG size: {svg_size}")
if png_size != expected_pixels:
    raise RuntimeError(f"unexpected PNG size: {png_size}")

print(f"matplotlib {matplotlib.__version__} ({matplotlib.get_backend()} backend)")
print(f"target                   {width_in:.2f} x {height_in:.2f} in at {dpi} dpi")
print(f"{pdf.name:<24} PDF {pdf_size[0]:.2f} x {pdf_size[1]:.2f} in")
print(f"{svg.name:<24} SVG {svg_size[0]:.2f} x {svg_size[1]:.2f} in")
print(f"{png.name:<24} PNG {png_size[0]} x {png_size[1]} px")
print(f"png title metadata      {png_title}")
Each failed dimension check raises an exception instead of printing a success report for an incorrectly sized file.
- Run publication_figure_export.py from the Python environment that has Matplotlib installed.
$ python publication_figure_export.py
matplotlib 3.11.0 (agg backend)
target                   3.50 x 2.40 in at 300 dpi
publication-figure.pdf   PDF 3.50 x 2.40 in
publication-figure.svg   SVG 3.50 x 2.40 in
publication-figure.png   PNG 1050 x 720 px
png title metadata      Publication figure export
- Confirm that exports/publication-figure.png has readable labels, distinct series, and no clipped plot elements.

Mohd Shakir Zakaria is a cloud architect with deep roots in software development and open-source advocacy. Certified in AWS, Red Hat, VMware, ITIL, and Linux, he specializes in designing and managing robust cloud and on-premises infrastructures.


