Plot typography affects whether titles, axis labels, and tick values remain readable after a figure leaves Python. Matplotlib can apply one family list and a consistent size hierarchy to every text object created by a plotting script.
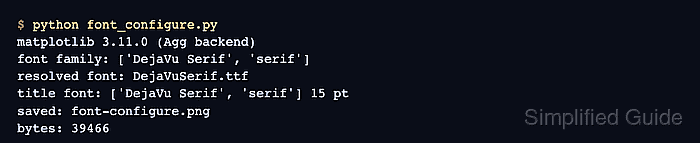
Runtime settings in rcParams change the defaults for the current Python process without editing a user or system configuration file. Applying them before the figure is created keeps the title, labels, and tick text on the same project-level typography baseline.
Matplotlib resolves font families in list order, so a concrete family can be followed by a generic group such as serif. DejaVu Serif ships with common Matplotlib installations; the resolved .ttf file, reported text sizes, and saved PNG show whether the requested settings reached the rendered plot.
Steps to configure Matplotlib fonts:
- Initialize font_configure.py with the plotting imports and quarterly data.
- font_configure.py
from pathlib import Path

import matplotlib
from matplotlib import font_manager
import matplotlib.pyplot as plt


quarters = ["Q1", "Q2", "Q3", "Q4"]
satisfaction = [82, 86, 88, 91]
- Set the runtime font family and size defaults in font_configure.py.
plt.rcParams.update(
    {
        "font.family": ["DejaVu Serif", "serif"],
        "font.size": 12,
        "axes.titlesize": 15,
        "axes.labelsize": 12,
        "xtick.labelsize": 10,
        "ytick.labelsize": 10,
    }
)
font.size supplies the general default, while the axes and tick settings establish the size hierarchy for their specific text roles.
- Add fail-capable font resolution to font_configure.py.
requested_family = plt.rcParams["font.family"]
resolved_font = Path(
    font_manager.findfont(
        font_manager.FontProperties(family=requested_family),
        fallback_to_default=False,
    )
)
resolved_family = font_manager.get_font(resolved_font).family_name
fallback_to_default=False raises an error when none of the requested concrete or generic families can resolve to a usable font file.
- Append the plot construction, image export, and font checks to font_configure.py.
fig, ax = plt.subplots(figsize=(6.4, 3.8), layout="constrained")
ax.plot(quarters, satisfaction, marker="o", linewidth=2.2, color="#3E6C9A")
title = ax.set_title("Customer satisfaction trend", fontweight="bold")
xlabel = ax.set_xlabel("Quarter")
ax.set_ylabel("Score")
ax.grid(True, axis="y", alpha=0.25)

output = Path("font-configure.png")
fig.savefig(output, dpi=160)
plt.close(fig)

print(f"matplotlib {matplotlib.__version__} ({matplotlib.get_backend()} backend)")
print(f"font family: {requested_family}")
print(f"resolved font: {resolved_font.name} ({resolved_family})")
print(f"title size: {title.get_fontsize():.0f} pt")
print(f"axis label size: {xlabel.get_fontsize():.0f} pt")
print(f"saved: {output}")
print(f"bytes: {output.stat().st_size}")
- Run font_configure.py from the directory that should receive the exported plot.
$ python3 font_configure.py
matplotlib 3.10.7+dfsg1 (agg backend)
font family: ['DejaVu Serif', 'serif']
resolved font: DejaVuSerif.ttf (DejaVu Serif)
title size: 15 pt
axis label size: 12 pt
saved: font-configure.png
bytes: 41103
The byte count can change with the Matplotlib version, backend, operating system, and font renderer. The resolved family and reported sizes should match the configured values.
- Verify the configured serif hierarchy in font-configure.png from its relative text sizes.
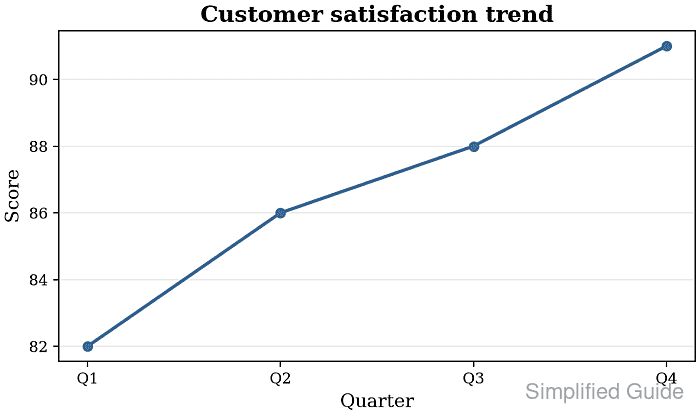
The title should be larger than the axis labels, and the tick labels should be the smallest text in the figure.

Mohd Shakir Zakaria is a cloud architect with deep roots in software development and open-source advocacy. Certified in AWS, Red Hat, VMware, ITIL, and Linux, he specializes in designing and managing robust cloud and on-premises infrastructures.


