Sending Filebeat events directly to Elasticsearch keeps log shipping simple when the Beat can reach the cluster without a Logstash or queueing layer in between. Use this path for small stacks, first-pass observability rollouts, or hosts where the output should land in the default Filebeat data stream.
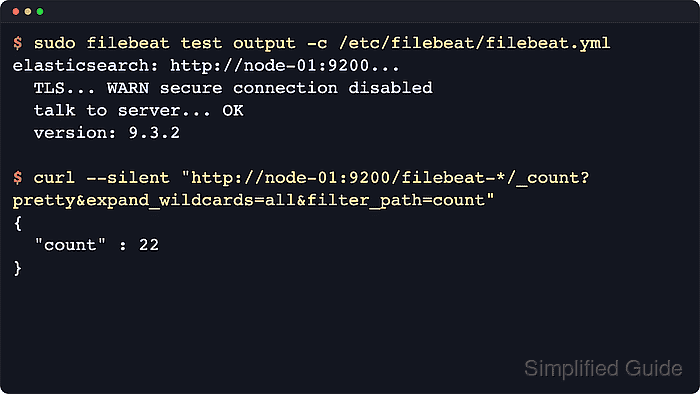
The active handoff is the output.elasticsearch block in /etc/filebeat/filebeat.yml. Filebeat reads enabled inputs such as filestream, publishes events to the configured cluster, and uses the current Filebeat version in the default filebeat-<version> data stream when index-management assets are loaded.
The cluster must be reachable with credentials that can publish events, and Filebeat still needs at least one enabled input or module before any log data can arrive. Recent filestream inputs use fingerprint-based file identity by default, so a tiny smoke-test file may wait until it grows beyond the first 1024 bytes before harvesting begins.
Steps to ingest logs from Filebeat into Elasticsearch:
- Back up the active Filebeat configuration.
$ sudo cp /etc/filebeat/filebeat.yml /etc/filebeat/filebeat.yml.bak
- Configure the Elasticsearch output in /etc/filebeat/filebeat.yml.
output.elasticsearch:
  hosts: ["http://node-01:9200"]
Only one output.* block can be enabled. Disable output.logstash, output.kafka, output.file, and other outputs before publishing directly to Elasticsearch.
Use username and password, api_key, and ssl.certificate_authorities when the cluster requires authentication or HTTPS. Store secrets in the Filebeat keystore instead of cleartext YAML.
Related: How to add a secret to a Filebeat keystore
Related: How to use an Elasticsearch API key with Filebeat output
Related: How to configure Filebeat for TLS - Confirm Filebeat has an enabled input that points at real log files.
filebeat.inputs:
  - type: filestream
    id: app-logs
    enabled: true
    paths:
      - /var/log/myapp/*.log
Use a stable id and avoid overlapping path globs across inputs. For custom application formats that need parsed fields, create and test an ingest pipeline before routing production logs through it.
Related: How to configure a filestream input in Filebeat
Tool: Filebeat Grok Pattern Generator - Test the Filebeat configuration.
$ sudo filebeat test config -c /etc/filebeat/filebeat.yml
Config OK
Related: How to test a Filebeat configuration
- Test the direct Elasticsearch output.
$ sudo filebeat test output -c /etc/filebeat/filebeat.yml
elasticsearch: http://node-01:9200...
  parse url... OK
  connection...
    parse host... OK
    dns lookup... OK
    addresses: 192.0.2.25
    dial up... OK
  TLS... WARN secure connection disabled
  talk to server... OK
  version: 9.4.2
talk to server… OK followed by the Elasticsearch version confirms that Filebeat can reach the configured output with the active credentials and TLS settings.
Related: How to test Filebeat output connectivity - Load the Elasticsearch index-management assets.
$ sudo filebeat setup --index-management -c /etc/filebeat/filebeat.yml
Overwriting lifecycle policy is disabled. Set `setup.ilm.overwrite: true` to overwrite.
Index setup finished.
--index-management loads the Filebeat template, ILM policy, and data-stream assets without importing dashboards. If enabled modules need ingest pipelines, run filebeat setup --pipelines --modules <module-list> as a separate setup task.
Related: How to run Filebeat setup for templates and dashboards
Related: How to enable a Filebeat module - Restart the Filebeat service.
$ sudo systemctl restart filebeat
- Check that Filebeat returned to an active state.
$ sudo systemctl status filebeat --no-pager --lines=20 ● filebeat.service - Filebeat sends log files to Logstash or Elasticsearch. Loaded: loaded (/usr/lib/systemd/system/filebeat.service; enabled; preset: enabled) Active: active (running) since Thu 2026-06-18 12:15:34 UTC; 8s ago Main PID: 4821 (filebeat) ##### snipped ##### - Generate or wait for a new application event in a watched log file.
For a filestream smoke test, use a normal application log file or a test file larger than 1024 bytes. Smaller files can be delayed by the default fingerprint scanner even when the output is configured correctly.
- Refresh the Filebeat data stream when checking an immediate smoke-test event.
$ curl --silent --request POST "http://node-01:9200/filebeat-*/_refresh?expand_wildcards=all"
{"_shards":{"total":2,"successful":1,"failed":0}}
Skip this manual refresh when waiting for the normal Elasticsearch refresh interval is acceptable.
- Confirm the Filebeat data stream exists in Elasticsearch.
$ curl --silent "http://node-01:9200/_data_stream/filebeat-*?pretty&filter_path=data_streams.name,data_streams.indices.index_name,data_streams.ilm_policy"
{
  "data_streams" : [
    {
      "name" : "filebeat-9.4.2",
      "indices" : [
        {
          "index_name" : ".ds-filebeat-9.4.2-2026.06.18-000001"
        }
      ],
      "ilm_policy" : "filebeat"
    }
  ]
}
A default direct-to-Elasticsearch setup creates a filebeat-<version> data stream backed by .ds-filebeat-* indices.
- Count the ingested Filebeat documents.
$ curl --silent "http://node-01:9200/filebeat-*/_count?pretty&expand_wildcards=all"
{
  "count" : 40,
  "_shards" : {
    "total" : 1,
    "successful" : 1,
    "skipped" : 0,
    "failed" : 0
  }
}
expand_wildcards=all keeps the count check valid when the matching documents are stored in hidden .ds-filebeat-* backing indices. Use the same request with --user and --cacert options for secured clusters.

Mohd Shakir Zakaria is a cloud architect with deep roots in software development and open-source advocacy. Certified in AWS, Red Hat, VMware, ITIL, and Linux, he specializes in designing and managing robust cloud and on-premises infrastructures.


