Checking a service status with systemctl shows whether systemd loaded the unit correctly, whether the service is running now, and what the most recent unit log lines say. It is the fastest read-only check after a restart, configuration change, boot problem, or report that a daemon stopped responding.
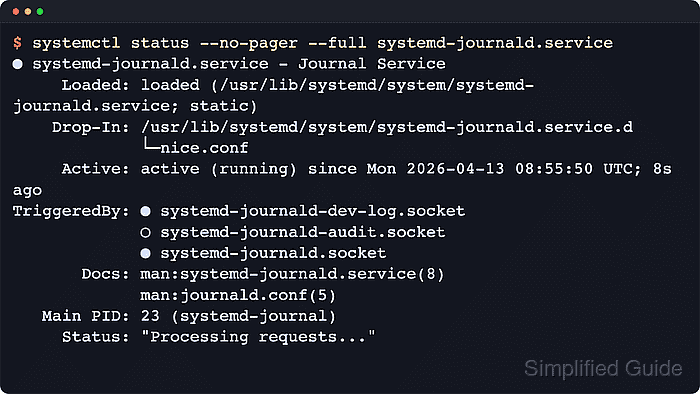
Upstream systemctl documentation describes status as a human-readable runtime view that combines the unit summary with recent journal entries. The same documentation recommends systemctl show when a script or monitor needs normalized properties instead of the formatted status screen.
The status view covers the current invocation or the most recent invocation still in memory, so older boots and older failures belong in journalctl. A unit that uses Type=oneshot with RemainAfterExit=yes can also show active (exited) even though no long-running process remains, which is normal for that unit type.
Steps to check service status using systemctl:
- Open a terminal session on the host that runs the target systemd manager.
Use the exact unit name, including suffixes such as .service or .socket. Add sudo only when the host restricts unit details or recent journal lines.
- Print the full status view for the target unit.
$ systemctl status --no-pager --full systemd-journald.service
● systemd-journald.service - Journal Service
     Loaded: loaded (/usr/lib/systemd/system/systemd-journald.service; static)
    Drop-In: /usr/lib/systemd/system/systemd-journald.service.d
             └─nice.conf
     Active: active (running) since Tue 2026-04-21 22:44:34 UTC; 45s ago
TriggeredBy: ● systemd-journald-dev-log.socket
             ○ systemd-journald-audit.socket
             ● systemd-journald.socket
       Docs: man:systemd-journald.service(8)
             man:journald.conf(5)
   Main PID: 23 (systemd-journal)
     Status: "Processing requests..."
      Tasks: 1 (limit: 28491)
   FD Store: 3 (limit: 4224)
     Memory: 5.8M (peak: 13.7M)
        CPU: 203ms
     CGroup: /system.slice/systemd-journald.service
             └─23 /usr/lib/systemd/systemd-journald
Apr 21 22:44:34 server systemd-journald[23]: Collecting audit messages is disabled.
Apr 21 22:44:34 server systemd-journald[23]: Journal started
##### snipped #####
Replace systemd-journald.service with the real unit name. --no-pager keeps the output in the terminal, and --full prevents long lines from being ellipsized.
- Read the Loaded: and Active: lines first.
Loaded: shows whether systemd found and parsed the unit file, while Active: shows the current runtime state and substate such as active (running), failed, or inactive (dead).
static in the Loaded: line means the unit has no install symlinks to enable or disable. It does not mean the service is stopped or broken.
- Check the normalized state fields when the formatted status screen is more detail than needed.
$ systemctl show -p LoadState -p ActiveState -p SubState -p UnitFileState systemd-journald.service
LoadState=loaded
ActiveState=active
SubState=running
UnitFileState=static
systemctl show is the stable property view for scripts, monitoring checks, and exact field comparisons.
- Read the unit journal directly when the status view shows a failure, a restart loop, or an unexpected status message.
$ sudo journalctl -u systemd-journald.service -n 6 --no-pager
Apr 21 22:44:34 server systemd-journald[23]: Collecting audit messages is disabled.
Apr 21 22:44:34 server systemd-journald[23]: Journal started
Apr 21 22:44:34 server systemd-journald[23]: Runtime Journal (/run/log/journal/##### snipped #####) is 8.0M, max 1.1G, 1.1G free.
Apr 21 22:44:34 server systemd-journald[23]: Time spent on flushing to /var/log/journal/##### snipped ##### is 9.391ms for 1396 entries.
Apr 21 22:44:34 server systemd-journald[23]: System Journal (/var/log/journal/##### snipped #####) is 8.0M, max 4.0G, 3.9G free.
Apr 21 22:44:34 server systemd-journald[23]: Received client request to flush runtime journal.
systemctl status already includes a short log tail, but journalctl -u is the clearer follow-up when the unit needs deeper diagnosis or older lines.

Mohd Shakir Zakaria is a cloud architect with deep roots in software development and open-source advocacy. Certified in AWS, Red Hat, VMware, ITIL, and Linux, he specializes in designing and managing robust cloud and on-premises infrastructures.


