Ollama logs show server startup, model loading, GPU detection, cloud status, and request errors that do not always appear in client output. They are the quickest place to separate a bad request from a server-side runtime issue.
Log locations depend on how Ollama is installed. Linux service installs use journalctl, macOS stores app and server logs under ~/.ollama/logs, and Windows stores logs under the user's local app data path.
Use logs as a diagnosis surface, then retest the failing command. A log line without a repeated client check can point to an old event instead of the current problem.
Related: How to manage the Ollama service
Related: How to check Ollama server status
Related: How to check Ollama GPU support
Steps to view Ollama logs:
- View Linux service logs with journalctl.
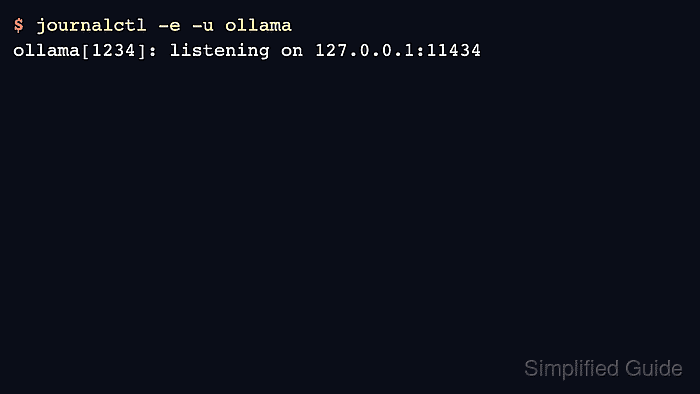
$ journalctl -e -u ollama
Jul 07 04:42:10 host ollama[1234]: listening on 127.0.0.1:11434
- Follow new Linux log lines while reproducing the failure.
$ journalctl -fu ollama
Jul 07 04:42:13 host ollama[1234]: loaded model gpt-oss:20b
- Open macOS Ollama log files from the user profile.
$ ls ~/.ollama/logs
app.log
server.log
- Open Windows logs from LocalAppData.
$ explorer %LOCALAPPDATA%\Ollama
Inspect app.log, server.log, and upgrade.log in that folder.
- Retest the API after identifying the relevant log line.
$ curl -s http://localhost:11434/api/version
{"version":"0.31.1"}

Mohd Shakir Zakaria is a cloud architect with deep roots in software development and open-source advocacy. Certified in AWS, Red Hat, VMware, ITIL, and Linux, he specializes in designing and managing robust cloud and on-premises infrastructures.


