Apache Spark writes runtime evidence in different places because the driver, executors, cluster manager, and history server do not all own the same process. A failed stage, missing executor, or noisy user log line is much easier to investigate when the application ID is matched to the log source that actually ran the work.
Driver logs show driver startup, application messages, and client-mode failures. Executor or container logs show task-side stdout, stderr, JVM messages, and executor crashes. Event logs are a separate history-server input; they preserve Spark scheduler and UI events for replay, but they are not a replacement for process stdout and stderr.
Start with the application ID, deploy mode, and cluster manager before opening files. Use neutral local paths, YARN IDs, and Kubernetes names in shared notes, then replace them with the values from the submit output, Spark UI, YARN application report, or Kubernetes pod list for the application being checked.
Related: How to check Spark application status
Related: How to open the Apache Spark web UI
Related: How to enable the Spark History Server
Steps to view Apache Spark logs:
- Identify the log source for the application runtime.
local or client deploy mode: driver terminal or configured driver log file
standalone cluster: worker application directory or Spark UI executor log links
YARN: yarn logs -applicationId <application-id>
Kubernetes: kubectl logs -n <namespace> <driver-pod>
Use event logs for history-server replay and completed-application UI state. Use driver, executor, container, or pod logs when you need stdout, stderr, user logging, JVM messages, or task failure output.
Related: How to enable Spark event logging
Related: How to enable the Spark History Server - List the applications visible from the active Spark UI source when the submit output does not already show the application ID.
$ curl --silent http://localhost:4040/api/v1/applications
[
  {
    "id": "local-1783371802652",
    "name": "sg-logs-view",
    "attempts": [
      {
        "completed": false,
        "sparkUser": "spark"
      }
    ]
  }
]
Use a live driver UI such as http://driver.example.net:4040/api/v1 while the application is running. Use a history server such as http://history.example.net:18080/api/v1 after the driver has stopped and event logs are available.
Related: How to check Spark application status
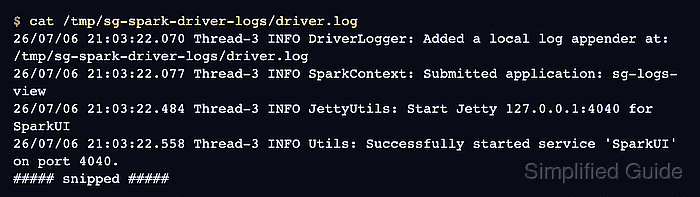
Related: How to open the Apache Spark web UI - Read the configured driver log file when spark.driver.log.localDir is set.
$ cat /tmp/sg-spark-driver-logs/driver.log
26/07/06 21:03:22.070 Thread-3 INFO DriverLogger: Added a local log appender at: /tmp/sg-spark-driver-logs/driver.log
26/07/06 21:03:22.077 Thread-3 INFO SparkContext: Submitted application: sg-logs-view
26/07/06 21:03:22.484 Thread-3 INFO JettyUtils: Start Jetty 127.0.0.1:4040 for SparkUI
26/07/06 21:03:22.558 Thread-3 INFO Utils: Successfully started service 'SparkUI' on port 4040.
##### snipped #####
The driver log path must be configured before the application starts. In ordinary client mode without a configured driver log directory, the driver output is the terminal or scheduler service that launched spark-submit.
- Check the event-log directory only when the question is history-server replay or completed-application UI state.
$ ls /tmp/spark-events/eventlog_v2_local-1783371802652
appstatus_local-1783371802652
events_1_local-1783371802652.zstd
Event log files are Spark event data for the history server. Do not treat them as the source for application stdout, stderr, or executor JVM error messages.
Related: How to enable Spark event logging
Related: How to enable the Spark History Server - Fetch YARN container logs when the application ran under YARN.
$ yarn logs -applicationId application_1736200100000_0042
Container: container_1736200100000_0042_01_000001 on worker-01.example.net
LogType: stdout
LogLastModifiedTime: Mon Jul 06 21:03:25 +0000 2026
LogLength: 43
Log Contents:
Pi is roughly 3.141851570742146
##### snipped #####
yarn logs needs YARN log aggregation for completed applications to be readable from any client node. Without aggregation, use the Spark UI executor links or inspect the retained NodeManager log directory on the node that ran the container.
Related: How to submit a Spark job to YARN
- Read the Kubernetes driver pod log when the application ran under Kubernetes.
$ kubectl logs -n spark-jobs spark-pi-509d429f393b50cb-driver
##### snipped #####
Pi is roughly 3.140931140931141
##### snipped #####
For executor-side failures, list the Spark pods for the same application and read the failed executor pod log instead of relying only on the driver pod output.
- Confirm the retrieved log excerpt belongs to the target application before troubleshooting from it.
Application ID: local-1783371802652
Application name: sg-logs-view
Log source: /tmp/sg-spark-driver-logs/driver.log
Matched log line: INFO SparkContext: Submitted application: sg-logs-view
Keep the application ID, pod name, container ID, or driver log path with the excerpt when handing it to another operator. That context prevents a YARN container log, Kubernetes pod log, and history-server event log from being mistaken for each other.
Tool: Application Log Pattern Analyzer

Mohd Shakir Zakaria is a cloud architect with deep roots in software development and open-source advocacy. Certified in AWS, Red Hat, VMware, ITIL, and Linux, he specializes in designing and managing robust cloud and on-premises infrastructures.


