A submitted Spark application can be alive in the driver web UI, replayed from the Spark History Server, or missing because event logging was not enabled before it ended. Status review starts with the application ID and then narrows to jobs, stages, and executors so an operator can tell whether work is running, succeeded, failed, or waiting on cluster resources.
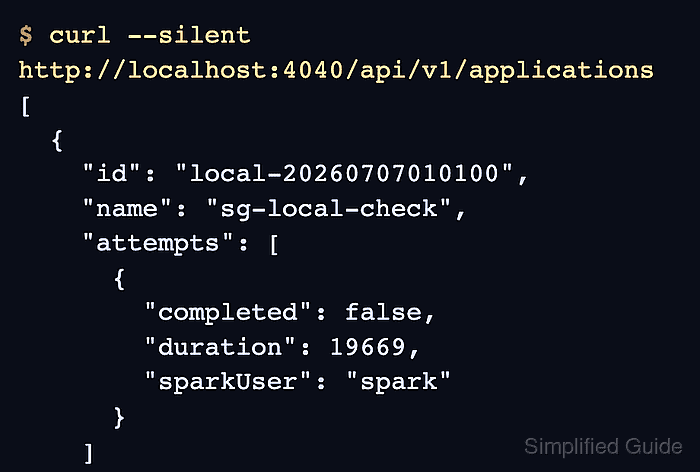
The REST API under /api/v1 exposes the same application store as JSON. A live driver normally serves it from port 4040, while the history server normally serves completed or replayed applications from port 18080 when event logs are available.
The live driver UI is the best source while an application is still running. History-server rows can lag for incomplete applications, and an application that crashed without a clean stop can still appear incomplete, so match the API source to the question being answered before acting on the status.
Related: How to open the Apache Spark web UI
Related: How to enable the Spark History Server
Related: How to view Apache Spark logs
Steps to check Spark application status:
- List the applications visible from the current Spark UI source.
$ curl --silent http://localhost:4040/api/v1/applications
[
  {
    "id": "local-20260707010100",
    "name": "sg-local-check",
    "attempts": [
      {
        "completed": false,
        "duration": 19669,
        "sparkUser": "spark"
      }
    ]
  }
]
Use the driver UI base for a running application, such as http://driver.example.net:4040/api/v1. Use the history server base, such as http://history.example.net:18080/api/v1, after the driver has stopped and event logs are available.
Related: How to open the Apache Spark web UI
Related: How to enable the Spark History Server - Copy the id value for the application being checked.
An attempt with completed set to false is still open from that UI source. In the history server, an incomplete row may mean the application is still running, has not been replayed yet, or exited without recording a clean stop.
- Check the job list for running, succeeded, failed, or unknown job state.
$ curl --silent http://localhost:4040/api/v1/applications/local-20260707010100/jobs
[
  {
    "jobId": 0,
    "name": "count at status_check.py:40",
    "status": "RUNNING",
    "numTasks": 4,
    "numCompletedTasks": 0
  }
]
Add ?status=running, ?status=succeeded, ?status=failed, or ?status=unknown when the application has many retained jobs and only one state matters.
- Check the stage list when the job state needs task-level context.
$ curl --silent http://localhost:4040/api/v1/applications/local-20260707010100/stages
[
  {
    "stageId": 0,
    "status": "ACTIVE",
    "numTasks": 4,
    "numCompleteTasks": 0
  }
]
Use ?status=active, ?status=complete, ?status=pending, or ?status=failed to focus the stage list. Task-level status filters such as RUNNING, SUCCESS, FAILED, KILLED, and PENDING require details=true.
- Check executor activity for the same application ID.
$ curl --silent http://localhost:4040/api/v1/applications/local-20260707010100/executors
[
  {
    "id": "driver",
    "isActive": true,
    "totalCores": 2,
    "totalTasks": 2,
    "completedTasks": 0,
    "failedTasks": 0
  }
]
For local mode, the driver can be the only executor row. On a cluster, inactive executors, failed tasks, or missing expected executors should be compared with the job and stage rows before deciding whether to inspect logs or stop the application.
Related: How to view Apache Spark logs
Related: How to kill a Spark application

Mohd Shakir Zakaria is a cloud architect with deep roots in software development and open-source advocacy. Certified in AWS, Red Hat, VMware, ITIL, and Linux, he specializes in designing and managing robust cloud and on-premises infrastructures.


