How to run a t-test with SciPy
Two independent groups can differ in average because their populations differ or because finite samples happened to vary. A t-test measures the observed mean difference relative to its sampling uncertainty, producing a statistic and p-value for a stated null hypothesis.
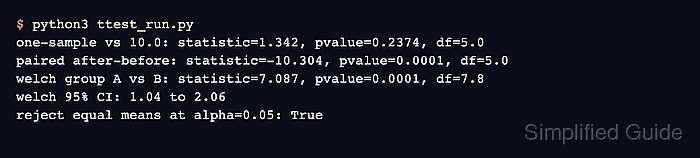
The scipy.stats.ttest_ind() function runs a two-sided Welch test when equal_var=False. Welch's method does not assume equal population variances, but the observations must still be independent and suitable for a mean-based parametric comparison.
SciPy reports the statistic and confidence interval in the direction of the first sample minus the second. Choose the significance threshold before examining the result, and read the p-value together with the mean difference and confidence interval because statistical significance alone does not describe the size of the difference.
Steps to run a t-test with SciPy:
- Create ttest_run.py with two independent measurement samples and the preselected significance threshold.
- ttest_run.py
import numpy as np
from scipy import stats

baseline_ms = np.array([142, 138, 151, 145, 139, 148, 143, 146])
candidate_ms = np.array([126, 132, 129, 124, 131, 128, 127])
alpha = 0.05
- Append the two-sided Welch test and confidence interval calculation after the sample arrays.
result = stats.ttest_ind(
    baseline_ms,
    candidate_ms,
    equal_var=False,
    alternative="two-sided",
)
interval = result.confidence_interval(confidence_level=1 - alpha)
mean_difference = baseline_ms.mean() - candidate_ms.mean()
- Append finite-result validation and report formatting after the confidence interval calculation.
reported_values = np.array([
    result.statistic,
    result.pvalue,
    result.df,
    interval.low,
    interval.high,
])
if not np.isfinite(reported_values).all():
    raise RuntimeError("t-test returned a non-finite result")

decision = (
    "reject equal means"
    if result.pvalue < alpha
    else "do not reject equal means"
)

print(f"mean difference: {mean_difference:.2f} ms")
print(f"t statistic: {result.statistic:.3f}")
print(f"p-value: {result.pvalue:.6f}")
print(f"degrees of freedom: {result.df:.2f}")
print(f"95% CI: {interval.low:.2f} to {interval.high:.2f} ms")
print(f"decision at alpha={alpha:.2f}: {decision}")
- Run the completed script to calculate the Welch t-test.
$ python3 ttest_run.py
mean difference: 15.86 ms
t statistic: 8.423
p-value: 0.000002
degrees of freedom: 11.96
95% CI: 11.75 to 19.96 ms
decision at alpha=0.05: reject equal means
The positive statistic and confidence interval show that the baseline_ms mean is higher than the candidate_ms mean. The p-value falls below 0.05, so these samples reject the equal-means null hypothesis at the selected threshold.