How to view Ollama logs
Ollama logs show server startup, model loading, GPU detection, cloud status, and request errors that do not always appear in client output. They are the quickest place to separate a bad request from a server-side runtime issue.
Log locations depend on how Ollama is installed. Linux service installs use journalctl, macOS stores app and server logs under ~/.ollama/logs, and Windows stores logs under the user's local app data path.
Use logs as a diagnosis surface, then retest the failing command. A log line without a repeated client check can point to an old event instead of the current problem.
Related: How to manage the Ollama service
Related: How to check Ollama server status
Related: How to check Ollama GPU support
Steps to view Ollama logs:
- View Linux service logs with journalctl.
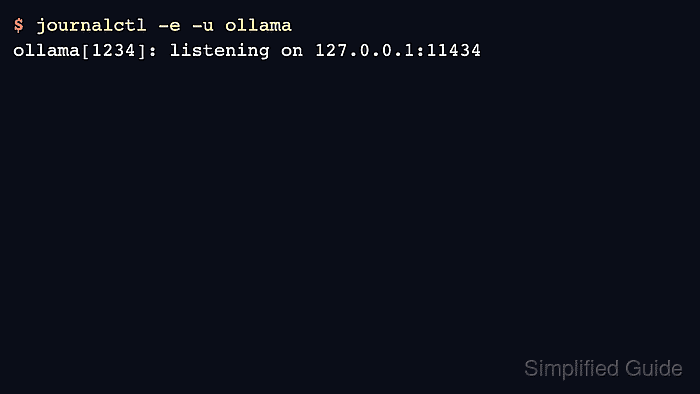
$ journalctl -e -u ollama
Jul 07 04:42:10 host ollama[1234]: listening on 127.0.0.1:11434
- Follow new Linux log lines while reproducing the failure.
$ journalctl -fu ollama
Jul 07 04:42:13 host ollama[1234]: loaded model gpt-oss:20b
- Open macOS Ollama log files from the user profile.
$ ls ~/.ollama/logs
app.log
server.log
- Open Windows logs from LocalAppData.
$ explorer %LOCALAPPDATA%\Ollama
Inspect app.log, server.log, and upgrade.log in that folder.
- Retest the API after identifying the relevant log line.
$ curl -s http://localhost:11434/api/version
{"version":"0.31.1"}