How to add error bars in Matplotlib
Measurements often carry a margin of uncertainty that a line or marker alone cannot show. In Matplotlib, Axes.errorbar() keeps each central observation and its uncertainty range on the same axes.
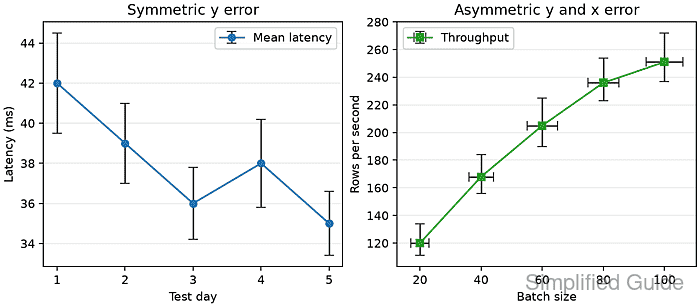
The yerr and xerr arguments accept one value for every point when the uncertainty is symmetric. Supplying only yerr draws vertical ranges, while combining xerr and yerr shows uncertainty in both plotted dimensions.
Asymmetric uncertainty uses a two-row array with shape (2, N): row 0 contains the lower distances and row 1 contains the upper distances. Every error distance must be nonnegative, and a nonzero capsize makes the ends visible because the default cap length is zero.
Related: How to create a line chart in Matplotlib
Related: How to create a scatter plot in Matplotlib
Related: How to save a Matplotlib figure
Steps to add error bars in Matplotlib:
- Create error_bar_add.py with the imports and measurement arrays.
- error_bar_add.py
from pathlib import Path

import matplotlib.image as mpimg
import matplotlib.pyplot as plt
import numpy as np

days = np.array([1, 2, 3, 4, 5])
mean_latency = np.array([42, 39, 36, 38, 35])
latency_error = np.array([2.5, 2.0, 1.8, 2.2, 1.6])

batch_size = np.array([20, 40, 60, 80, 100])
throughput = np.array([120, 168, 205, 236, 251])
batch_error = np.array([3, 4, 5, 5, 6])
lower_error = np.array([9, 12, 15, 13, 14])
upper_error = np.array([14, 16, 20, 18, 21])
asymmetric_error = np.vstack([lower_error, upper_error])
latency_error supplies one symmetric vertical distance per point. Stacking the lower and upper arrays creates the shape (2, N) required for asymmetric distances.
- Add the figure and symmetric vertical error bars after the asymmetric_error line.
- error_bar_add.py
fig, (ax_left, ax_right) = plt.subplots(
    ncols=2,
    figsize=(8.2, 3.6),
    layout="constrained",
)

symmetric = ax_left.errorbar(
    days,
    mean_latency,
    yerr=latency_error,
    fmt="o-",
    capsize=4,
    elinewidth=1.4,
    ecolor="0.25",
    label="Mean latency",
)
ax_left.set_title("Symmetric y error")
ax_left.set_xlabel("Test day")
ax_left.set_ylabel("Latency (ms)")
ax_left.grid(True, axis="y", alpha=0.25)
ax_left.legend()
fmt=“o-” draws circular markers connected by a line. ecolor and elinewidth style the uncertainty bars independently from that line.
- Add horizontal and asymmetric vertical error bars after the left-panel legend.
- error_bar_add.py
asymmetric = ax_right.errorbar(
    batch_size,
    throughput,
    xerr=batch_error,
    yerr=asymmetric_error,
    fmt="s-",
    capsize=4,
    elinewidth=1.4,
    ecolor="0.25",
    color="tab:green",
    label="Throughput",
)
ax_right.set_title("Asymmetric y and x error")
ax_right.set_xlabel("Batch size")
ax_right.set_ylabel("Rows per second")
ax_right.grid(True, axis="y", alpha=0.25)
ax_right.legend()
xerr draws the horizontal ranges. Row 0 of asymmetric_error extends below each throughput value, while row 1 extends above it.
- Finish the script with PNG export and plot-object checks.
- error_bar_add.py
output = Path("error-bar-add.png")
fig.savefig(output, dpi=160)
plt.close(fig)

pixels = mpimg.imread(output)
symmetric_directions = len(symmetric.lines[2])
asymmetric_directions = len(asymmetric.lines[2])

if symmetric_directions != 1:
    raise RuntimeError("symmetric error bars were not created")
if asymmetric_directions != 2:
    raise RuntimeError("horizontal and vertical error bars were not created")

print(f"symmetric error directions: {symmetric_directions}")
print(f"asymmetric error directions: {asymmetric_directions}")
print(f"image shape: {pixels.shape[0]} x {pixels.shape[1]} x {pixels.shape[2]}")
print(f"saved: {output}")
The returned ErrorbarContainer stores horizontal and vertical bar collections separately. The checks fail if the left plot does not contain one error direction or the right plot does not contain both directions.
- Run the completed script from the Python environment that has Matplotlib installed.
$ python3 error_bar_add.py
symmetric error directions: 1
asymmetric error directions: 2
image shape: 576 x 1312 x 4
saved: error-bar-add.png
- Inspect error-bar-add.png for the symmetric and asymmetric uncertainty ranges.
The left panel should show equal vertical distances above and below every marker. The right panel should show horizontal ranges plus unequal lower and upper vertical distances.