How to run Espresso tests in Android Studio
Android Studio is often the fastest place to reproduce an Espresso failure because the IDE keeps the test source, target device, and result tree close together. A developer can start one class or method from the editor and see whether the issue belongs to the app screen, the emulator, or the test assertion.
An Espresso test is an Android instrumented test, so it runs on an emulator or physical device instead of only the host JVM. Android Studio Bumblebee and newer use Gradle for instrumented test runs, and the Run window exposes the task output behind the selected IDE action.
Start from a synced app module with AndroidJUnitRunner configured and at least one test under the androidTest source set. The pass or failure boundary is the Run window or Test Matrix result for the selected class or method, not only a successful app build.
Related: How to write a first Espresso test
Steps to run Espresso tests in Android Studio:
- Sync the project with Gradle from the Android Studio toolbar.
- Start the target emulator or connect a physical device.
- Select the emulator or device from the target device drop-down.
- Open the Espresso test class under the app module's androidTest source set.
In the Android project view, instrumented tests appear under the module's java test source set for androidTest.
- Click the Run test gutter icon beside the test class or method.
Right-clicking the class or method and selecting Run starts the same IDE test run when gutter icons are hidden.
- Open Run → Edit Configurations when the generated configuration uses the wrong module or runner.
- Select an Android Instrumented Tests configuration for the app module and set the instrumentation runner to AndroidJUnitRunner.
Use the configuration created from the gutter action when it already targets the expected module and test scope.
Related: How to configure an Android project for Espresso - Click Run in the toolbar to start the selected Espresso test.
- Check the Run window or Test Matrix for the selected test result.
The result tree should mark the selected class or method as passed. A failed run still gives a reproduction point when the warning count and stack trace identify the failing assertion.
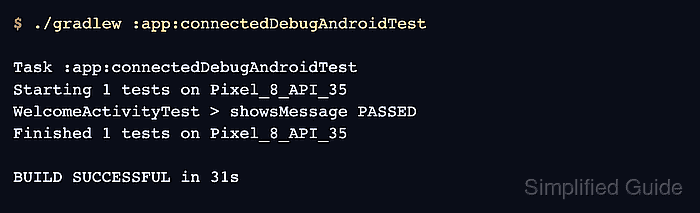
- Verify command-line parity when the IDE result needs to match a local terminal run.
$ ./gradlew :app:connectedDebugAndroidTest

> Task :app:connectedDebugAndroidTest
Starting 1 tests on Pixel_8_API_35
WelcomeActivityTest > showsMessage PASSED
Finished 1 tests on Pixel_8_API_35

BUILD SUCCESSFUL in 31s
Android Studio Bumblebee and newer, with Android Gradle Plugin 7.1.0 or newer, use the same instrumented test runner as the connected Gradle task.
Related: How to run Espresso tests locally