How to configure a Logstash UDP input
Configuring a Logstash udp input lets Logstash receive fire-and-forget datagrams from applications, appliances, or local test senders that do not keep a persistent connection. It fits lightweight event delivery when each packet carries a complete message and sender overhead needs to stay low.
The udp input listens on the configured host and port, decodes each datagram with its input codec, and records the packet source address on the event. On package-managed Linux systems, Logstash normally reads settings from /etc/logstash and loads pipeline snippets from /etc/logstash/conf.d into the main pipeline unless /etc/logstash/pipelines.yml defines a different layout.
UDP has no delivery acknowledgement, so congestion can still cause packet loss, duplication, or out-of-order delivery. The first rollout should use an unprivileged localhost port, validate the pipeline as the logstash service account, and widen the bind address only after the listener receives the expected payload.
Steps to configure a Logstash UDP input:
- Confirm that the planned UDP port is not already in use.
$ sudo ss --udp --listening --numeric --processes --no-header 'sport = :5515'
No output means no local UDP listener is bound to port 5515. Ports below 1024, including the traditional syslog UDP port 514, are privileged and can prevent Logstash from starting as the packaged logstash user.
- Open a dedicated pipeline file for the UDP listener.
$ sudoedit /etc/logstash/conf.d/27-udp-input.conf
- Add the UDP input and a temporary debug output.
input {
  udp {
    id => "udp_json_5515"
    host => "127.0.0.1"
    port => 5515
    codec => json {
      target => "[event][payload]"
    }
    source_ip_fieldname => "[source][ip]"
  }
}

output {
  stdout {
    id => "stdout_udp_debug"
    codec => rubydebug
  }
}
Use the json codec only when each datagram is one complete JSON document. The codec target nests decoded fields under event.payload, and source_ip_fieldname stores the sender address in source.ip.
The localhost bind keeps the first test private. Change host to the required service address or 0.0.0.0 only after validation, pair the wider bind with firewall rules, and tune queue_size or receive_buffer_bytes before accepting bursty senders.
- Test the pipeline file with the packaged settings directory and a temporary data path.
$ sudo -u logstash /usr/share/logstash/bin/logstash \
  --path.settings /etc/logstash \
  --path.data /tmp/logstash-udp-input-configtest \
  --config.test_and_exit \
  -f /etc/logstash/conf.d/27-udp-input.conf
Using bundled JDK: /usr/share/logstash/jdk
[2026-04-08T14:18:41,106][WARN ][logstash.config.source.multilocal] Ignoring the 'pipelines.yml' file because command line options are specified
Configuration OK
[2026-04-08T14:18:41,941][INFO ][logstash.runner          ] Using config.test_and_exit mode. Config Validation Result: OK. Exiting Logstash
--config.test_and_exit validates syntax and settings assembly without proving runtime network delivery. The temporary --path.data directory must be writable by the logstash account and keeps the check away from /var/lib/logstash.
Related: How to test a Logstash pipeline configuration - Remove the temporary validation data directory.
$ sudo rm -rf /tmp/logstash-udp-input-configtest
- Restart the Logstash service so it loads the UDP pipeline.
$ sudo systemctl restart logstash.service
Restarting the service pauses every active pipeline briefly while inputs reopen and outputs reconnect.
- Confirm that the Logstash service returned to the running state.
$ sudo systemctl is-active logstash.service
active
If the command returns failed or stays in activating, inspect sudo journalctl --unit=logstash.service --no-pager --lines=80 before sending test datagrams.
Related: How to manage the Logstash service with systemctl in Linux - Verify that the udp listener is bound to port 5515.
$ sudo ss --udp --listening --numeric --processes --no-header 'sport = :5515'
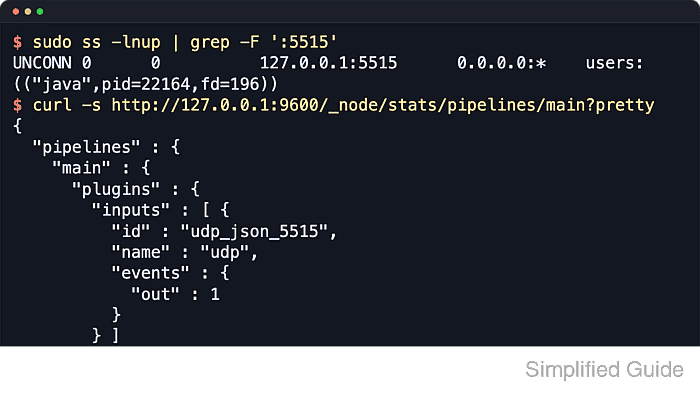
UNCONN 0      0          127.0.0.1:5515      0.0.0.0:*    users:(("java",pid=22164,fd=196))
If host was changed to a service address or 0.0.0.0, the bind target shown by ss should match that configured address.
- Send a single JSON test datagram to the new listener.
$ printf '{"message":"udp input validation","service":"billing","level":"info"}' | nc -u -w 1 127.0.0.1 5515One datagram becomes one event in this validation flow. Replace 127.0.0.1 with the real Logstash address when testing from another host, and validate hand-built JSON before sending it so a malformed payload is not mistaken for a listener problem.
Tool: JSON Validator - Query the Logstash monitoring API and confirm that the named UDP input handled the event.
$ curl --silent http://127.0.0.1:9600/_node/stats/pipelines/main?pretty
{
  "pipelines" : {
    "main" : {
      "events" : {
        "filtered" : 1,
        "in" : 1,
        "out" : 1
      },
      "plugins" : {
        "inputs" : [ {
          "id" : "udp_json_5515",
          "name" : "udp",
          "events" : {
            "out" : 1
          }
        } ]
      }
    }
  }
}
The explicit input id keeps the input counters readable when the same pipeline contains multiple listeners. If the active pipeline ID is not main, replace it in the API path.
- Review recent journal lines for listener startup and the decoded event.
$ sudo journalctl --unit=logstash.service --since "5 minutes ago" --no-pager --lines=40
Apr 08 14:21:05 logstash-01 logstash[22164]: [2026-04-08T14:21:05,368][INFO ][logstash.inputs.udp      ][main][udp_json_5515] Starting UDP listener {:address=>"127.0.0.1:5515"}
Apr 08 14:21:24 logstash-01 logstash[22164]: {
Apr 08 14:21:24 logstash-01 logstash[22164]:       "event" => {
Apr 08 14:21:24 logstash-01 logstash[22164]:     "payload" => {
Apr 08 14:21:24 logstash-01 logstash[22164]:      "message" => "udp input validation",
Apr 08 14:21:24 logstash-01 logstash[22164]:      "service" => "billing",
Apr 08 14:21:24 logstash-01 logstash[22164]:        "level" => "info"
Apr 08 14:21:24 logstash-01 logstash[22164]:      }
Apr 08 14:21:24 logstash-01 logstash[22164]:    },
Apr 08 14:21:24 logstash-01 logstash[22164]:      "source" => {
Apr 08 14:21:24 logstash-01 logstash[22164]:          "ip" => "127.0.0.1"
Apr 08 14:21:24 logstash-01 logstash[22164]:    }
Apr 08 14:21:24 logstash-01 logstash[22164]: }
With the temporary stdout output shown earlier, the journal confirms that the UDP payload was decoded by the running packaged service. After the listener works, replace stdout with the real output section and re-run the same config test before the next restart.
Related: How to configure a Logstash stdout output
Related: How to configure Logstash pipelines
Related: How to debug Logstash pipelines