How to use the Logstash dissect filter
The dissect filter in Logstash splits fixed-format log lines into named fields without running a regular expression. It fits events whose delimiters and field order stay the same, such as an application log that always starts with a timestamp, level, service name, status code, duration, and message text.
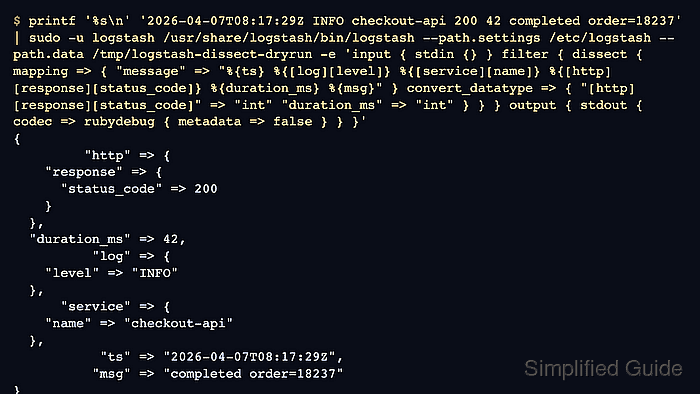
A dissect mapping combines literal delimiters with placeholders such as {field}. Nested placeholders like {[service][name]} write directly into structured fields, empty placeholders such as {} skip unwanted segments, and append placeholders such as {+ts} combine repeated segments into one field.
Keep dissect inside a condition that matches only the source format it expects. Missing delimiters or unexpected optional sections add the default _dissectfailure tag unless tag_on_failure is changed, and convert_datatype can turn selected captures into int or float values after the mapping runs.
Related: How to parse logs with grok in Logstash
Related: How to use the Logstash date filter
Steps to use the Logstash dissect filter:
- Dry-run the mapping against one representative log line.
$ printf '%s\n' '2026-04-07T08:17:29Z INFO checkout-api 200 42 completed order=18237' | sudo -u logstash /usr/share/logstash/bin/logstash \
  --path.settings /etc/logstash \
  --path.data /tmp/logstash-dissect-dryrun \
  -e 'input { stdin {} }
filter {
  dissect {
    id => "dissect_app_log"
    mapping => {
      "message" => "%{ts} %{[log][level]} %{[service][name]} %{[http][response][status_code]} %{duration_ms} %{msg}"
    }
    convert_datatype => {
      "[http][response][status_code]" => "int"
      "duration_ms" => "int"
    }
    tag_on_failure => ["_dissectfailure"]
  }
}
output { stdout { codec => rubydebug { metadata => false } } }'
{
         "http" => {
    "response" => {
      "status_code" => 200
    }
  },
  "duration_ms" => 42,
          "log" => {
    "level" => "INFO"
  },
      "service" => {
    "name" => "checkout-api"
  },
           "ts" => "2026-04-07T08:17:29Z",
          "msg" => "completed order=18237"
}
The dry run keeps the live service pipeline untouched. Replace the sample line and mapping with a real line from the target source before saving the filter.
- Add the dissect pipeline fragment under /etc/logstash/conf.d/50-dissect.conf.
input {
  file {
    path => "/var/lib/logstash/examples/dissect.log"
    start_position => "beginning"
    sincedb_path => "/var/lib/logstash/sincedb-dissect"
    tags => ["dissect_demo"]
  }
}

filter {
  if "dissect_demo" in [tags] {
    dissect {
      id => "dissect_app_log"
      mapping => {
        "message" => "%{ts} %{[log][level]} %{[service][name]} %{[http][response][status_code]} %{duration_ms} %{msg}"
      }
      convert_datatype => {
        "[http][response][status_code]" => "int"
        "duration_ms" => "int"
      }
      tag_on_failure => ["_dissectfailure"]
    }
  }
}

output {
  if "dissect_demo" in [tags] {
    elasticsearch {
      hosts => ["http://elasticsearch.example.net:9200"]
      index => "app-dissect-%{+YYYY.MM.dd}"
    }
  }
}
The input and output blocks show a complete package-style pipeline. In an existing pipeline, copy only the dissect block into the matching filter branch.
Related: How to configure a Logstash file input
Related: How to configure Logstash output to Elasticsearch - Test the updated pipeline configuration with the packaged settings directory.
$ sudo -u logstash /usr/share/logstash/bin/logstash --path.settings /etc/logstash --path.data /tmp/logstash-configtest --config.test_and_exit
Using bundled JDK: /usr/share/logstash/jdk
Configuration OK
The temporary --path.data directory keeps the syntax test away from the live service data directory. Current Logstash package installs should run this check as the logstash service account unless allow_superuser has been changed deliberately.
Related: How to test a Logstash pipeline configuration - Restart logstash.service to load the updated filter.
$ sudo systemctl restart logstash.service
Restarting Logstash briefly pauses active ingestion while pipelines stop, compile, and reconnect.
- Confirm the dissect plugin is receiving events in the monitoring API.
$ curl --silent --show-error "http://localhost:9600/_node/stats/pipelines/main?pretty=true&filter_path=pipelines.main.plugins.filters.id,pipelines.main.plugins.filters.name,pipelines.main.plugins.filters.events"
{
  "pipelines" : {
    "main" : {
      "plugins" : {
        "filters" : [ {
          "id" : "dissect_app_log",
          "name" : "dissect",
          "events" : {
            "in" : 12844,
            "out" : 12844
          }
        } ]
      }
    }
  }
}
Replace main when the filter runs in another pipeline ID. If the API is secured or moved from localhost:9600, use the host, port, TLS, and authentication settings from /etc/logstash/logstash.yml.
Related: How to check Logstash pipeline metrics - Fetch a recent indexed event and confirm the parsed fields exist.
$ curl --silent --get "http://elasticsearch.example.net:9200/app-dissect-*/_search" \
  --data-urlencode "size=1" \
  --data-urlencode "filter_path=hits.hits._index,hits.hits._source.ts,hits.hits._source.log,hits.hits._source.service,hits.hits._source.http,hits.hits._source.duration_ms,hits.hits._source.msg" \
  --data-urlencode "pretty"
{
  "hits" : {
    "hits" : [ {
      "_index" : "app-dissect-2026.04.07",
      "_source" : {
        "ts" : "2026-04-07T08:17:29Z",
        "log" : {
          "level" : "INFO"
        },
        "service" : {
          "name" : "checkout-api"
        },
        "http" : {
          "response" : {
            "status_code" : 200
          }
        },
        "duration_ms" : 42,
        "msg" : "completed order=18237"
      }
    } ]
  }
}
The parsed ts field remains a string here. Use the date filter when that source timestamp should replace @timestamp.
- Search for dissect failure tags after the rollout.
$ curl --silent --get "http://elasticsearch.example.net:9200/app-dissect-*/_search" \
  --data-urlencode "q=tags:_dissectfailure" \
  --data-urlencode "size=0" \
  --data-urlencode "filter_path=hits.total" \
  --data-urlencode "pretty"
{
  "hits" : {
    "total" : {
      "value" : 0,
      "relation" : "eq"
    }
  }
}
A non-zero count usually means the delimiter pattern no longer matches every incoming line. Split variable formats with conditionals or use grok when the source has optional sections.