Model latency often comes from a small set of tensor operators hidden inside an otherwise ordinary forward pass. The PyTorch profiler records those operators, their call counts, and their timing so the expensive work can be identified before model code is changed.
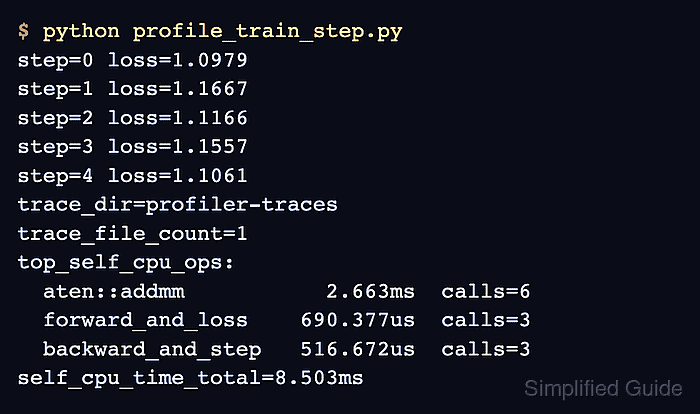
The profiler context should wrap a short workload that uses representative tensor shapes. A warm-up outside that context avoids mixing one-time startup work into the recorded range, while record_function() gives the trace a recognizable application-level label.
The aggregated key_averages() table provides an immediate operator ranking, and export_chrome_trace() preserves the same run as a JSON event timeline. Shape recording adds profiler overhead, so the sample keeps the active window short and leaves the exported trace available for deeper inspection.
Steps to run the PyTorch profiler:
- Create the model and input foundation in profile_model.py.
- profile_model.py
import torch
from torch import nn
from torch.profiler import ProfilerActivity, profile, record_function


torch.manual_seed(7)

model = nn.Sequential(
    nn.Linear(8, 16),
    nn.ReLU(),
    nn.Linear(16, 4),
)
model.eval()
inputs = torch.randn(32, 8)
- Add a warm-up block after the input tensor in profile_model.py.
with torch.inference_mode():
    for _ in range(5):
        model(inputs)
- Add the profiler block after the warm-up block in profile_model.py.
with torch.inference_mode():
    with profile(
        activities=[ProfilerActivity.CPU],
        record_shapes=True,
    ) as profiler:
        with record_function("model_inference"):
            for _ in range(10):
                model(inputs)
ProfilerActivity.CPU records host operators. CUDA workloads need ProfilerActivity.CUDA alongside CPU activity and CUDA-resident model inputs.
Related: How to enable CUDA in PyTorch - Append the operator table after the profiler block in profile_model.py.
print(
    profiler.key_averages().table(
        sort_by="self_cpu_time_total",
        row_limit=6,
    )
)
- Append the trace export after the operator table in profile_model.py.
profiler.export_chrome_trace("profile_trace.json")
- Compare the completed profile_model.py file with the consolidated version.
- profile_model.py
import torch
from torch import nn
from torch.profiler import ProfilerActivity, profile, record_function


torch.manual_seed(7)

model = nn.Sequential(
    nn.Linear(8, 16),
    nn.ReLU(),
    nn.Linear(16, 4),
)
model.eval()
inputs = torch.randn(32, 8)

with torch.inference_mode():
    for _ in range(5):
        model(inputs)

with torch.inference_mode():
    with profile(
        activities=[ProfilerActivity.CPU],
        record_shapes=True,
    ) as profiler:
        with record_function("model_inference"):
            for _ in range(10):
                model(inputs)

print(
    profiler.key_averages().table(
        sort_by="self_cpu_time_total",
        row_limit=6,
    )
)
profiler.export_chrome_trace("profile_trace.json")
- Confirm that profile_trace.json can be replaced in the project directory.
The export call writes to this fixed path when the script runs.
- Run the completed profiler script from its project directory.
$ python profile_model.py
----------------------  ------------  ------------  ------------  ------------  ------------  ------------
                  Name    Self CPU %      Self CPU   CPU total %     CPU total  CPU time avg    # of Calls
----------------------  ------------  ------------  ------------  ------------  ------------  ------------
           aten::addmm        87.79%      28.962ms        88.57%      29.220ms       1.461ms            20
       model_inference         6.94%       2.289ms       100.00%      32.991ms      32.991ms             1
               aten::t         1.73%     570.204us         3.34%       1.102ms      55.121us            20
       aten::transpose         1.41%     466.629us         1.61%     532.213us      26.611us            20
          aten::linear         0.55%     180.415us        92.46%      30.503ms       1.525ms            20
           aten::copy_         0.53%     175.752us         0.53%     175.752us       8.788us            20
----------------------  ------------  ------------  ------------  ------------  ------------  ------------
Self CPU time total: 32.991ms
Some PyTorch builds write profiler_start and profiler_stop diagnostics to stderr. The operator table is the profiler report.
- Validate the exported trace as JSON with Python's standard library.
$ python -m json.tool profile_trace.json
{
    "schemaVersion": 1,
    "deviceProperties": [],
    ##### snipped #####
    "traceEvents": [
        {
            "ph": "X",
            "cat": "user_annotation",
            "name": "model_inference",
            ##### snipped #####
        }
    ],
    "traceName": "profile_trace.json"
}

Mohd Shakir Zakaria is a cloud architect with deep roots in software development and open-source advocacy. Certified in AWS, Red Hat, VMware, ITIL, and Linux, he specializes in designing and managing robust cloud and on-premises infrastructures.


