Adding a Prometheus data source in Grafana lets dashboards, Explore queries, and alert rules read metrics from a Prometheus API endpoint. Use a manual data source when the connection belongs to one Grafana organization and does not need to be managed from provisioning files.

Grafana sends Prometheus requests from the Grafana server, container, or pod, not from the browser that opens the settings page. The Prometheus server URL must therefore be reachable from that runtime, and localhost usually points at Grafana itself when Grafana runs in a separate container.
The user saving the connection needs permission to create or edit data sources. Save & test confirms that Grafana can query the Prometheus API, and an Explore query such as up confirms that the saved source can return metrics for later dashboards and alerts.
Steps to add a Prometheus data source in Grafana:
- Confirm that the Prometheus readiness endpoint responds from a network path Grafana can use.
$ curl http://prometheus.example.internal:9090/-/ready
Prometheus Server is Ready.
Use the address Grafana will use as the data source URL. In separate containers, localhost inside Grafana does not point at the Prometheus container.
- Open Connections → Add new connection and search for Prometheus.
- Select the Prometheus data source plugin.
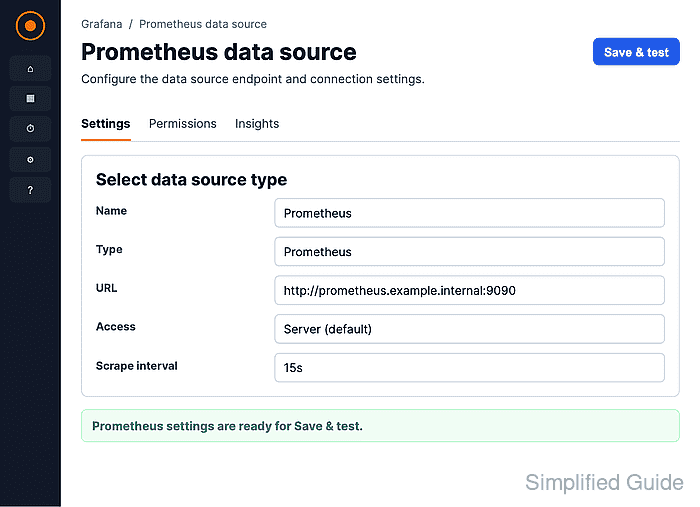
- Click Add new data source on the Prometheus plugin page.

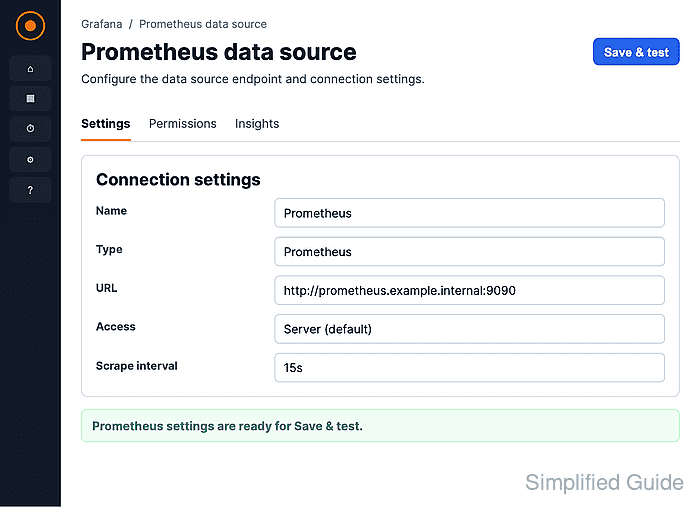
- Enter a clear Name and the Prometheus server URL.

Use a stable internal DNS name or service name where possible. In Docker or Kubernetes deployments, the service name is usually safer than a workstation-only address. Select the matching authentication, TLS, or managed-service settings when the Prometheus endpoint requires them.
- Click Save & test and confirm the success message.

Grafana reports Successfully queried the Prometheus API. when the URL and connection settings work.
- Open Explore from the saved data source and run a simple PromQL query.

The query up should return a series with value 1 for a scraped target when Prometheus has collected recent samples.
Related: How to use Grafana query inspector

Mohd Shakir Zakaria is a cloud architect with deep roots in software development and open-source advocacy. Certified in AWS, Red Hat, VMware, ITIL, and Linux, he specializes in designing and managing robust cloud and on-premises infrastructures.


