Building a Grafana dashboard from Prometheus node exporter metrics turns raw host counters into panels for CPU pressure, available memory, and other Linux system signals. It is useful after Prometheus is already scraping node exporter targets and the operator needs a saved dashboard instead of one-off Explore queries.

Grafana panels query the Prometheus data source with PromQL and render the result with a visualization such as Time series or Stat. Node exporter series are usually prefixed with node_, and the first check should confirm that up{job="node"} returns the intended instance label before panel queries are saved.
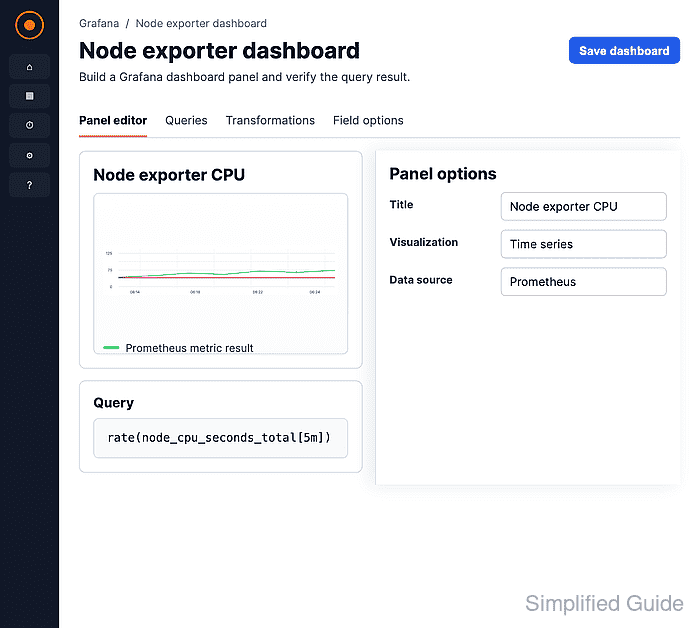
A host dashboard usually starts with one CPU busy time series from node_cpu_seconds_total and one memory available stat from node_memory_MemAvailable_bytes. Choose a time range long enough for Prometheus rate calculations to have at least two scrapes, then save the dashboard after each panel returns data.
Steps to build a Grafana dashboard from Prometheus node exporter metrics:
- Open Explore.
- Select the Prometheus data source.
- Run a target check for node exporter series.
up{job="node"}The result should return the host's instance label with value 1. If no series appears, fix the Prometheus scrape job before creating panels.
- Open Dashboards → New → New dashboard.
- Click the Add new element icon.
- Choose Configure visualization.
- Select Prometheus as the panel data source.
- Switch the query editor to Code mode.
- Enter the CPU busy query.
100 - (avg by (instance) (rate(node_cpu_seconds_total{mode="idle"}[5m])) * 100) - Click Run queries.

The query subtracts idle CPU time from 100 and groups the result by instance so each node exporter target stays visible as its own series.
- Keep Time series selected.
- Set the panel title to CPU busy by instance.
- Set the standard unit to Percent (0-100).
- Click Save.
- Enter a dashboard name and save the dashboard.
- Add another visualization from the saved dashboard.
- Enter the memory query.
node_memory_MemAvailable_bytes
- Click Run queries.
- Change the visualization to Stat.
- Set the unit to Bytes (IEC).
- Click Save.
- Open the saved dashboard and confirm both panels show data for the selected time range.
A fresh Prometheus target may need another scrape interval before a rate() query shows data.

Mohd Shakir Zakaria is a cloud architect with deep roots in software development and open-source advocacy. Certified in AWS, Red Hat, VMware, ITIL, and Linux, he specializes in designing and managing robust cloud and on-premises infrastructures.


