Creating a Grafana alert rule lets Grafana notify operators when a metric crosses a threshold instead of waiting for someone to watch a dashboard. A Grafana-managed rule combines a query, a condition, and a notification target, then evaluates that condition on a schedule.

Grafana-managed alert rules live under Alerting and can use many data sources, including Prometheus, InfluxDB, and TestData DB. The rule editor previews the condition before saving, so an empty query, wrong reducer, or unsuitable threshold can be corrected before alerts route to responders.
Use an existing alert-compatible data source and contact point before creating a production rule. A lab rule can use TestData DB with Predictable Pulse to show a firing state without depending on a live service or external metrics backend.
Steps to create a Grafana-managed alert rule:
- Open Alerting → Alert rules in Grafana.
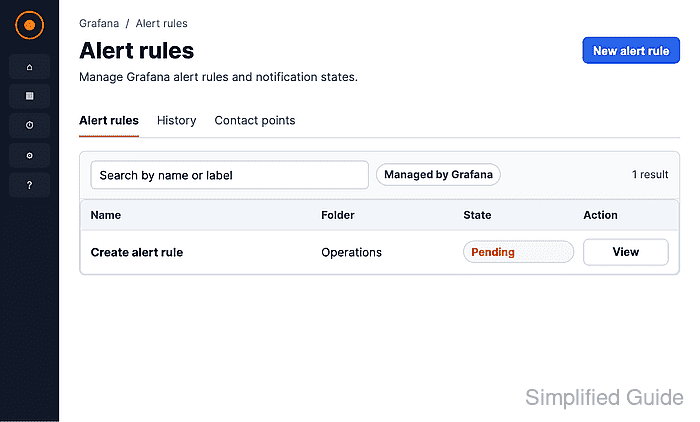
Some Grafana Cloud menus show Alerts & IRM before Alerting.
- Click New alert rule.
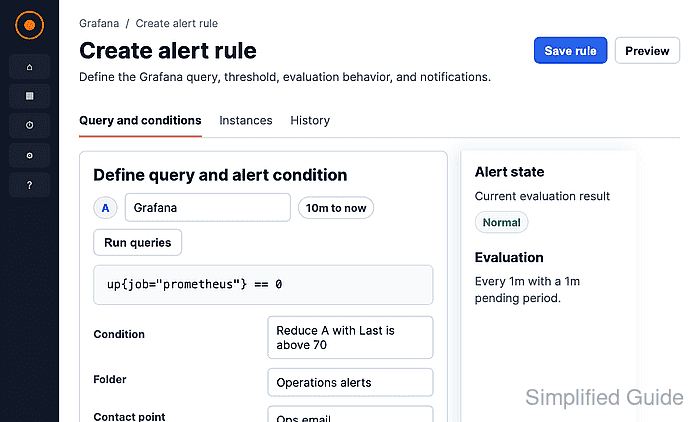
- Enter a rule name in the Name field.
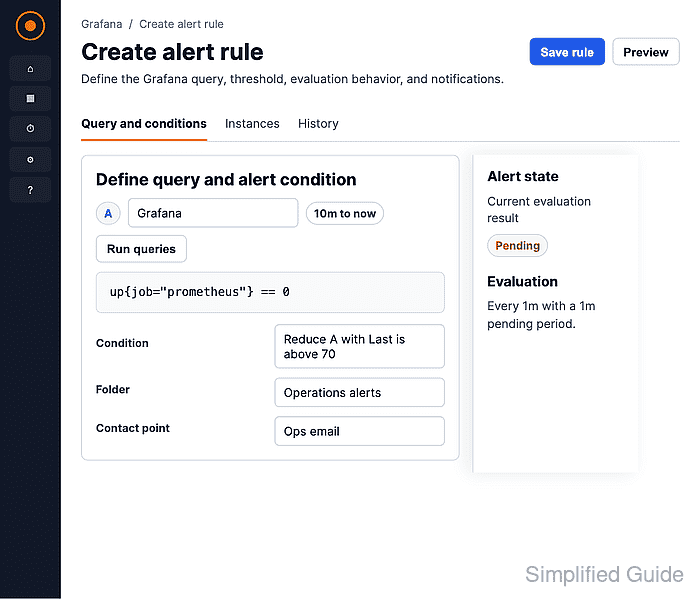
- Select the data source and query scenario for the alert.

The lab rule shown here uses TestData DB → Predictable Pulse because it returns predictable time-series values.
- Set the condition reducer, operator, and threshold, then click Preview alert rule condition.

WHEN Last OF QUERY IS ABOVE 0 shows a firing preview for the Predictable Pulse lab rule.
- Click New folder, enter Operations, and click Create.
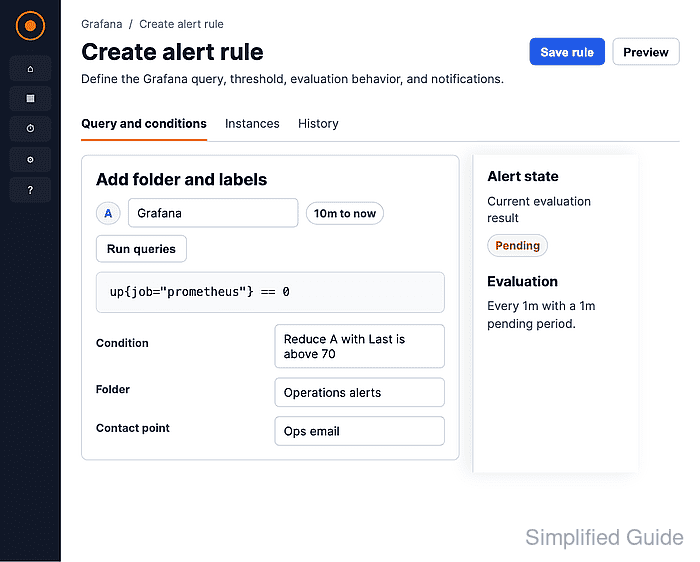
- Click New evaluation group, enter production-alerts, and click Create.

Rules in the same evaluation group run on the same interval.
- Set the Pending period and Keep firing for values.
None for Pending period lets a lab rule enter firing state immediately; production rules often use a delay to avoid notifications from short spikes.
- Select the contact point under Configure notifications.

- Add the alert summary, description, and optional Runbook URL.
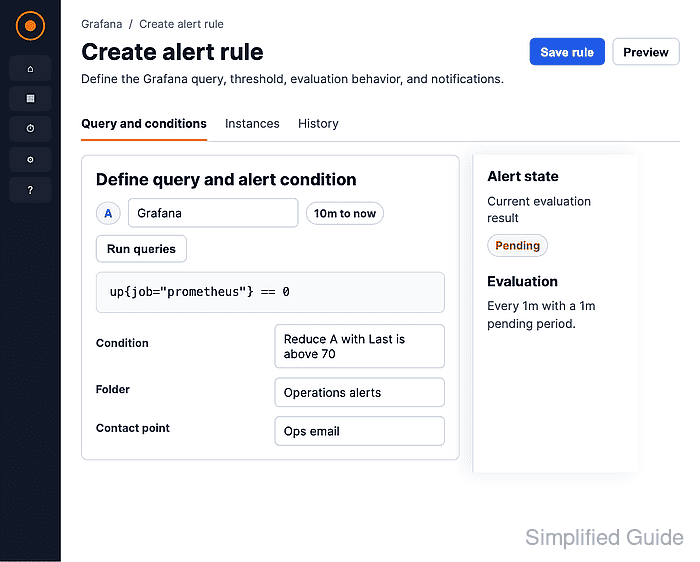
- Click Save.
- Open the rule group and confirm that the rule appears with the expected data source and alert instance count.

Mohd Shakir Zakaria is a cloud architect with deep roots in software development and open-source advocacy. Certified in AWS, Red Hat, VMware, ITIL, and Linux, he specializes in designing and managing robust cloud and on-premises infrastructures.


