Creating a Grafana alert from a Prometheus metric turns a PromQL expression into a scheduled rule that Grafana can evaluate and route to a contact point. Teams use these rules when an existing dashboard metric should also page, message, or notify someone when the measured condition changes.

Grafana-managed alert rules run the query through the selected Grafana data source, reduce the returned series to a threshold condition, and store the rule in a folder and evaluation group. The Prometheus data source must already be connected, and the account creating the alert needs permission to save rules in the target folder.
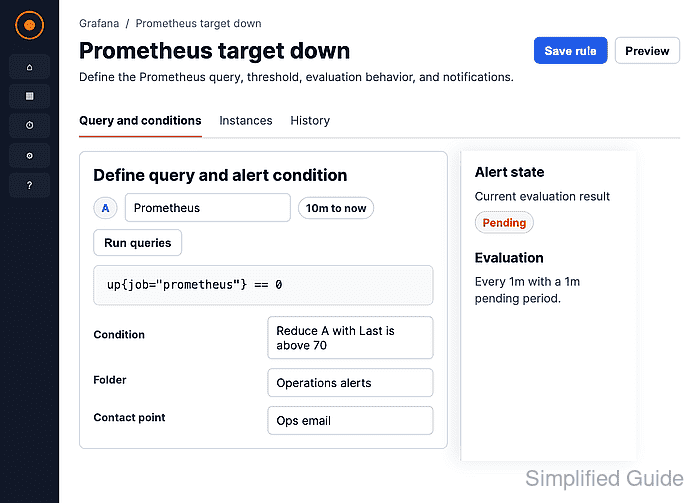
A target-down rule can use 1 - up{job="prometheus"} with a threshold above 0. The rule previews as Normal while up equals 1, and it can fire after the pending period when the expression returns a value above 0.
Steps to create a Grafana alert from Prometheus metrics:
- Open Alerting → Alert rules, then click New alert rule.
- Enter a rule name that identifies the Prometheus condition.
- Confirm the selected data source is Prometheus.
- Switch the query editor to Code mode.
- Enter the PromQL expression for the alert condition.
1 - up{job="prometheus"}
Replace job="prometheus" with labels that match the service or target being monitored. The expression should return one numeric value per alert instance.
- Click Run queries to confirm the query returns a numeric value.
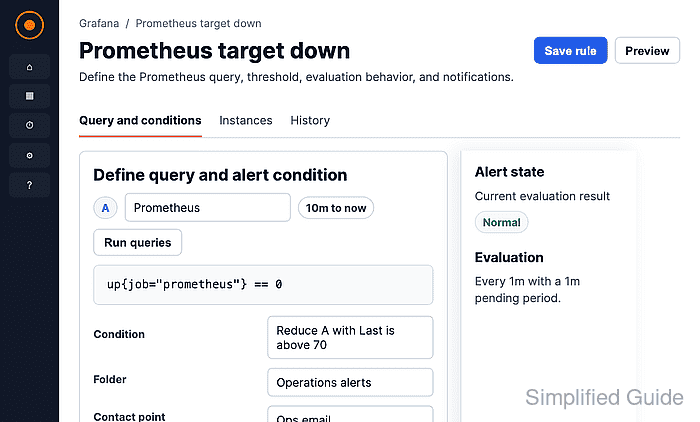
- Click Preview alert rule condition and confirm the expected state.

The target-down expression returns 0 while the scrape target is up, so the preview should show Normal when the target is reachable.
- Select the folder that should store the rule.
- Select an evaluation group or create a new one.

All rules in an evaluation group run on the group interval. Use a shorter interval for fast detection and a longer interval when the query is expensive.
- Set the Pending period for how long the condition must stay breached before firing.
- Select the contact point that should receive notifications.

Use the default notification mode to route this rule directly to a contact point. Enable Advanced options only when labels should route through notification policies.
- Add a Summary and Description for the notification message.
- Click Save.
- Open the saved rule and confirm the state, query, evaluation interval, and contact point.

Mohd Shakir Zakaria is a cloud architect with deep roots in software development and open-source advocacy. Certified in AWS, Red Hat, VMware, ITIL, and Linux, he specializes in designing and managing robust cloud and on-premises infrastructures.


