How to resample time series data in pandas
Event-level tables often contain several transactions inside one reporting period, while summaries and charts need a single row for each interval. pandas can collapse those irregular timestamps into calendar-aligned buckets without moving the timestamp column into the index permanently.
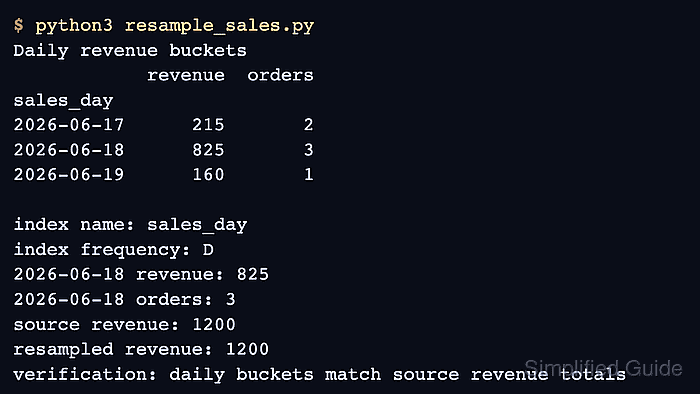
The DataFrame.resample() method works like a time-based groupby. The on=“sold_at” argument selects a datetime column for bucketing, and named aggregations produce separate daily revenue and order-count columns.
Daily bins use the left edge for labels and membership by default, but weekly and period-end offsets can use the right edge. Explicit label=“left” and closed=“left” values keep each displayed date aligned with the transactions from that calendar day.
Related: How to plot a pandas DataFrame
Related: How to read CSV files with pandas
Related: How to set an index in pandas
Steps to resample time series data in pandas:
- Save the timestamped sales rows and datetime conversion in resample_sales.py.
- resample_sales.py
import pandas as pd

sales = pd.DataFrame(
    {
        "sold_at": [
            "2026-06-17 08:15",
            "2026-06-17 11:40",
            "2026-06-18 09:05",
            "2026-06-18 13:10",
            "2026-06-18 18:30",
            "2026-06-19 10:20",
        ],
        "revenue": [120, 95, 180, 245, 400, 160],
    }
)
sales["sold_at"] = pd.to_datetime(sales["sold_at"])
- Add the daily resampling block after the timestamp conversion.
daily = sales.resample(
    "D", on="sold_at", label="left", closed="left"
).agg(
    revenue=("revenue", "sum"),
    orders=("revenue", "size"),
)
daily.index.name = "sales_day"
The “D” rule creates one calendar-day bucket. on=“sold_at” leaves the original timestamp column available in sales instead of making it the permanent row index.
- Append the assertions and result output after the daily aggregation.
assert daily.index.freqstr == "D"
assert int(daily.loc["2026-06-18", "revenue"]) == 825
assert int(daily.loc["2026-06-18", "orders"]) == 3
assert int(daily["revenue"].sum()) == int(sales["revenue"].sum())

print(daily.to_string())
print()
print("2026-06-18 revenue:", int(daily.loc["2026-06-18", "revenue"]))
print("2026-06-18 orders:", int(daily.loc["2026-06-18", "orders"]))
print("source revenue:", int(sales["revenue"].sum()))
print("resampled revenue:", int(daily["revenue"].sum()))
The known June 18 values check bucket membership, while the final assertion checks that resampling preserved the complete revenue total.
- Run resample_sales.py to display the asserted daily buckets.
$ python3 resample_sales.py
            revenue  orders
sales_day
2026-06-17      215       2
2026-06-18      825       3
2026-06-19      160       1

2026-06-18 revenue: 825
2026-06-18 orders: 3
source revenue: 1200
resampled revenue: 1200