Table of Contents
How to plot a pandas DataFrame
A DataFrame already carries the labels that make a chart readable: its index identifies observations, while its column names identify data series. Plotting a deliberately shaped view keeps those labels connected to the Matplotlib objects that draw the chart.
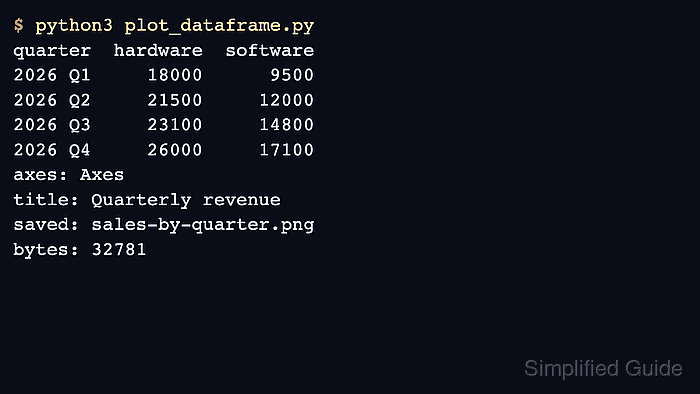
For quarterly revenue, the quarter values belong on the horizontal axis and the hardware and software columns belong in the legend. Moving quarter into the index before plotting makes that mapping explicit and keeps unrelated numeric columns out of the chart.
The DataFrame.plot() method returns the Axes that owns the bars, labels, and legend, so the chart can be refined without rebuilding it through pyplot. Legend labels and bar artists expose which series actually rendered, while reading the saved PNG verifies the export dimensions.
Related: How to create a pandas DataFrame
Related: How to read CSV files with pandas
Steps to turn selected DataFrame columns into a saved bar chart:
Shape the plotting view
- Select the plotting view by indexing sales on quarter and retaining the two revenue columns.
import pandas as pd

sales = pd.DataFrame(
    {
        "quarter": ["2026 Q1", "2026 Q2", "2026 Q3", "2026 Q4"],
        "hardware": [18000, 21500, 23100, 26000],
        "software": [9500, 12000, 14800, 17100],
    }
)

plot_data = sales.set_index("quarter")[["hardware", "software"]]
The index supplies the bar-group labels, and the explicit column list fixes both the plotted series and their legend order.
Use DataFrame.plot as the axes boundary
- Create ax directly from plot_data through DataFrame.plot().
ax = plot_data.plot(
    kind="bar",
    figsize=(7, 4),
    rot=0,
    title="Quarterly revenue",
)
- Label the returned Axes with the quarter and revenue dimensions.
ax.set_xlabel("Quarter")
ax.set_ylabel("Revenue (USD)")
- Name the legend after the revenue-series grouping.
ax.legend(title="Segment")
- Apply constrained layout to the Figure owned by ax.
figure = ax.get_figure()
figure.set_layout_engine("constrained")
Export and verify the selected series
- Save the assembled workflow as plot_dataframe.py with checks for the selected series, bar count, and PNG dimensions.
- plot_dataframe.py
from pathlib import Path

import matplotlib

matplotlib.use("Agg")

import matplotlib.image as mpimg
import pandas as pd


sales = pd.DataFrame(
    {
        "quarter": ["2026 Q1", "2026 Q2", "2026 Q3", "2026 Q4"],
        "hardware": [18000, 21500, 23100, 26000],
        "software": [9500, 12000, 14800, 17100],
    }
)

plot_data = sales.set_index("quarter")[["hardware", "software"]]

ax = plot_data.plot(
    kind="bar",
    figsize=(7, 4),
    rot=0,
    title="Quarterly revenue",
)
ax.set_xlabel("Quarter")
ax.set_ylabel("Revenue (USD)")
ax.legend(title="Segment")

figure = ax.get_figure()
figure.set_layout_engine("constrained")

series = ax.get_legend_handles_labels()[1]
bar_count = len(ax.patches)

assert plot_data.index.name == "quarter"
assert series == ["hardware", "software"]
assert bar_count == len(plot_data) * len(series)

output = Path("sales-by-quarter.png")
figure.savefig(output, dpi=150)

saved_image = mpimg.imread(output)
height, width = saved_image.shape[:2]

assert (width, height) == (1050, 600)

print(f"index: {plot_data.index.name}")
print(f"series: {', '.join(series)}")
print(f"bars: {bar_count}")
print(f"image: {width} x {height}")
print(f"saved: {output}")
- Run plot_dataframe.py to produce and verify sales-by-quarter.png.
$ python3 plot_dataframe.py
index: quarter
series: hardware, software
bars: 8
image: 1050 x 600
saved: sales-by-quarter.png
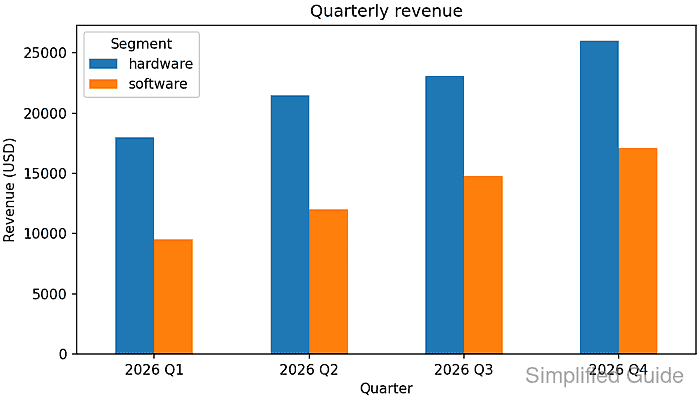
An assertion stops the script if the index mapping, selected legend series, eight expected bars, or exported canvas changes.