How to find unique values in a NumPy array
Categorical data often records one label per event, so repeated values can hide which states are actually present. Reducing the array to its distinct labels makes logs, survey answers, and model outputs easier to inspect before further grouping or reporting.
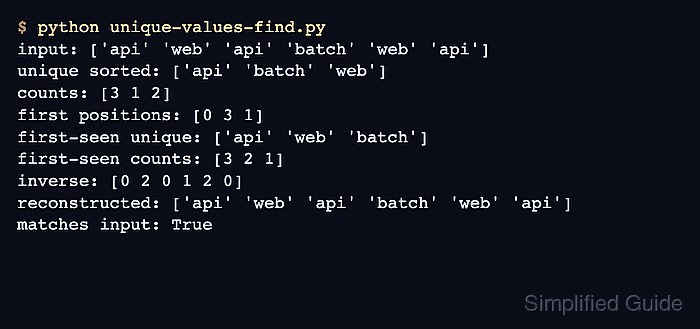
NumPy's np.unique() function accepts array-like input and returns values in sorted order by default. When axis is omitted, it flattens multidimensional input; the one-dimensional label array keeps each string as one element.
Setting return_counts=True adds a second array whose positions align with the returned labels. The counts should sum to the input size, which catches any mismatch between the displayed labels and the elements accounted for.
Related: Sort an array
Related: Calculate a histogram
Related: Calculate statistics
Steps to find unique values with NumPy:
- Create unique-values-find.py with the NumPy import and repeated label array.
- unique-values-find.py
import numpy as np

labels = np.array(["api", "web", "api", "batch", "web", "api"])
- Append the unique-value query and aligned count output to unique-values-find.py.
unique_values, counts = np.unique(labels, return_counts=True)

print("unique values:", unique_values)
print("counts:", counts)
print("count total:", counts.sum())
print("input size:", labels.size)
Each position in counts belongs to the value at the same position in unique_values.
- Run unique-values-find.py to verify that each sorted label has a count and all six input elements are accounted for.
$ python3 unique-values-find.py
unique values: ['api' 'batch' 'web']
counts: [3 1 2]
count total: 6
input size: 6
The matching totals confirm that the returned counts account for every input element.