How to compare JMeter throughput before and after a change
Throughput baselines turn a JMeter load run into a before-and-after release check instead of a single isolated number. Running the same workload window before and after an application or infrastructure change shows whether request rate, latency, or errors moved in a measurable way.
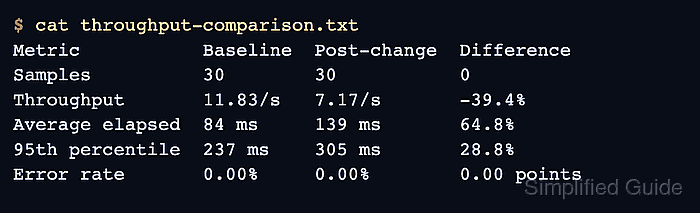
The comparison works best with one saved .jmx plan, two fresh .jtl result files, and two dashboard directories generated from non-GUI runs. Keep the thread group, timers, test data, target path, warmup, and duration unchanged so the planned application or infrastructure change is the only difference between the two windows.
Sample count and error rate need to match before throughput can be judged fairly. A lower throughput with the same sample count and zero errors usually points to slower responses, while a nonzero error rate means failed samplers or assertions must be reviewed before claiming a performance regression or improvement.
Steps to compare JMeter throughput before and after a change:
- Choose the saved test plan and fixed workload window for both runs.
Test plan: checkout-load.jmx
Thread group: unchanged
Timers: unchanged
Duration: unchanged
Baseline result: baseline.jtl
Post-change result: post-change.jtl
Keep the same CSV Data Set Config files, property overrides, target path, and runner capacity unless the change under test intentionally modifies one of them.
- Run the baseline window before applying the change.
$ jmeter -n -t checkout-load.jmx -l baseline.jtl -e -o baseline-dashboard
Creating summariser <summary>
Created the tree successfully using checkout-load.jmx
Starting standalone test @ 2026 Jun 30 21:43:45 GMT
Waiting for possible Shutdown/StopTestNow/HeapDump/ThreadDump message on port 4445
summary =     30 in 00:00:03 =   11.7/s Avg:    84 Min:    71 Max:   433 Err:     0 (0.00%)
Tidying up ...
... end of run
-n runs without the GUI, -t selects the plan, -l writes the sample result file, -e builds the dashboard after the run, and -o names the dashboard directory.
- Apply the application or infrastructure change under test.
Let the changed service reach the same ready state used for the baseline, such as a completed deployment, warmed dependency, or settled autoscaling group.
- Run the post-change window with fresh result and dashboard paths.
$ jmeter -n -t checkout-load.jmx -l post-change.jtl -e -o post-change-dashboard
Creating summariser <summary>
Created the tree successfully using checkout-load.jmx
Starting standalone test @ 2026 Jun 30 21:43:51 GMT
Waiting for possible Shutdown/StopTestNow/HeapDump/ThreadDump message on port 4445
summary =     30 in 00:00:04 =    7.1/s Avg:   139 Min:   121 Max:   516 Err:     0 (0.00%)
Tidying up ...
... end of run
The result file and dashboard directory names should be different from the baseline run so evidence cannot be overwritten.
- Check the baseline dashboard statistics.
$ cat baseline-dashboard/statistics.json
{
  "checkout-load" : {
##### snipped #####
  },
  "Total" : {
    "transaction" : "Total",
    "sampleCount" : 30,
    "errorCount" : 0,
    "errorPct" : 0.0,
    "meanResTime" : 84.43333333333334,
    "pct2ResTime" : 236.64999999999975,
    "throughput" : 11.829652996845425,
##### snipped #####
  }
}
Use the Total row for the whole run. Use a sampler label row only when the comparison is limited to one transaction. In a default JMeter dashboard, pct2ResTime is the 95th percentile.
- Check the post-change dashboard statistics.
$ cat post-change-dashboard/statistics.json { "checkout-load" : { ##### snipped ##### }, "Total" : { "transaction" : "Total", "sampleCount" : 30, "errorCount" : 0, "errorPct" : 0.0, "meanResTime" : 139.16666666666666, "pct2ResTime" : 304.7999999999997, "throughput" : 7.171886206072197, ##### snipped ##### } } - Create the comparison record from the two Total rows.
throughput-comparison.txt
Metric           Baseline  Post-change  Difference
Samples          30        30           0
Throughput       11.83/s   7.17/s       -39.4%
Average elapsed  84 ms     139 ms       64.8%
95th percentile  237 ms    305 ms       28.8%
Error rate       0.00%     0.00%        0.00 points
If the sample counts differ or the post-change run has new errors, compare failures and workload completeness before judging throughput.
- Confirm the saved comparison record.
$ cat throughput-comparison.txt
Metric           Baseline  Post-change  Difference
Samples          30        30           0
Throughput       11.83/s   7.17/s       -39.4%
Average elapsed  84 ms     139 ms       64.8%
95th percentile  237 ms    305 ms       28.8%
Error rate       0.00%     0.00%        0.00 points