How to read a JMeter Summary Report listener
A JMeter Summary Report listener condenses sample results into one row per sampler label plus a TOTAL row. The table shows how many requests ran, how many failed, and which labels need deeper review before a result is shared.
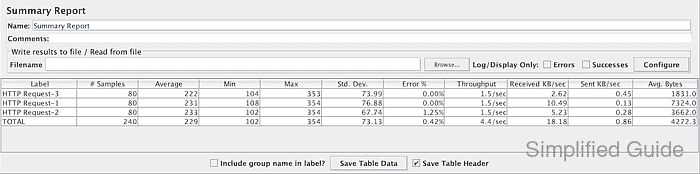
The listener is a compact GUI table, not a percentile report. It shows counts, elapsed-time averages, minimums, maximums, standard deviation, error rate, throughput, transfer rates, and average response size; use the dashboard or aggregate report when percentile lines and charts are required.
Use Summary Report during a small debug run or reload a saved results file after the load run has finished. Keep visual listeners out of real load tests when the runner should spend CPU and memory on traffic generation instead of GUI state.
Steps to read a JMeter Summary Report listener:
- Select the Summary Report listener for the run being reviewed.
The table creates one row for each distinct sampler Label. Enable Include group name in label? only when identical sampler names from different thread groups must stay separate.
- Read the # Samples column before interpreting rates.
# Samples is the count of sample events with the same label. The TOTAL row should equal the number of saved rows in the .jtl file, excluding the header.
- Check Error % before timing columns.
A nonzero Error % means failed samplers or assertions are included in the timing statistics. Open the failed rows in a result file, dashboard, or debug listener before accepting the timing numbers.
- Read Average, Min, Max, and Std. Dev. as elapsed time in milliseconds.
A high Max or Std. Dev. compared with the Average points to uneven response times. Use per-sample detail or the HTML dashboard to find the slow requests.
Related: How to generate a JMeter dashboard from an existing result file - Read Throughput with its displayed time unit.
JMeter chooses requests per second, minute, or hour so the displayed rate is at least 1.0. Timers and other samplers in the same thread can lower the shown rate because throughput is calculated over the time the requests were generated.
- Compare the listener count and error rate with a saved CLI result when the table needs confirmation.
$ jmeter -n -t checkout-summary.jmx -l checkout-summary.jtl
Creating summariser <summary>
Created the tree successfully using checkout-summary.jmx
Starting standalone test @ 2026 Jun 30 20:56:02 GMT
Waiting for possible Shutdown/StopTestNow/HeapDump/ThreadDump message on port 4445
summary =      4 in 00:00:01 =    3.9/s Avg:   250 Min:   131 Max:   504 Err:     1 (25.00%)
Tidying up ...
... end of run
The summary line confirms four samples and one failed sample, so a matching Summary Report table should show # Samples as 4 and Error % as 25.00 for the same label or TOTAL row.
Related: How to run a JMeter test from the command line - Inspect the saved .jtl rows when the failed sample needs a label, response code, or message.
$ cat checkout-summary.jtl
timeStamp,elapsed,label,responseCode,responseMessage,threadName,dataType,success,failureMessage,bytes,sentBytes,grpThreads,allThreads,URL,Latency,IdleTime,Connect
1782852963136,504,GET /checkout,200,OK,Checkout users 1-1,text,true,,15,0,1,1,null,0,0,0
1782852963641,131,GET /checkout,200,OK,Checkout users 1-1,text,true,,15,0,1,1,null,0,0,0
1782852963772,188,GET /checkout,500,Internal Server Error,Checkout users 1-1,text,false,,18,0,1,1,null,0,0,0
1782852963960,177,GET /checkout,200,OK,Checkout users 1-1,text,true,,15,0,1,1,null,0,0,0
The row with success=false is the failed sample counted by Error %. Keep the saved result file for deeper troubleshooting or dashboard generation.
Related: How to configure JMeter JTL result columns