How to generate an HTML dashboard report in JMeter
JMeter load-test evidence is easier to share when a command-line run produces the static HTML dashboard at the same time as the result file. The dashboard turns raw .jtl samples into charts, statistics, and browser-readable files that can be archived with a release or performance test record.
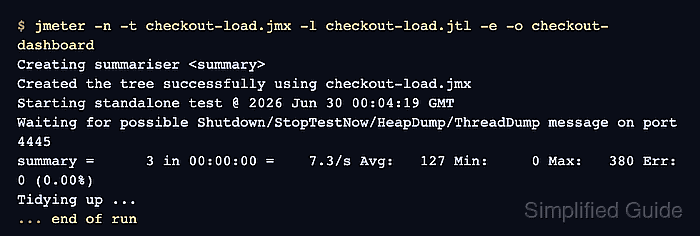
The end-of-run dashboard path uses one non-GUI execution to run the saved .jmx test plan, write the .jtl result file, and build the dashboard directory after the test finishes. The -e option enables report generation, and -o names the directory where JMeter writes index.html, graph assets, and statistics.json.
Use a new result file and a missing or empty dashboard directory for each run. If the test has already finished and only a saved .jtl file remains, generate the dashboard from that existing result file instead of rerunning traffic. Keep heavy GUI listeners out of load runs so the report is built from saved sample rows rather than from visual listener state.
Steps to generate an HTML dashboard at the end of a JMeter CLI run:
- Open a terminal in the directory that contains the saved .jmx test plan.
- Choose fresh result and dashboard paths for the run.
Test plan: checkout-load.jmx
Result file: checkout-load.jtl
Dashboard directory: checkout-dashboard
JMeter requires the dashboard directory named by -o to be missing or empty before report generation starts.
- Run the test plan in non-GUI mode with end-of-run dashboard generation enabled.
$ jmeter -n -t checkout-load.jmx -l checkout-load.jtl -e -o checkout-dashboard
Creating summariser <summary>
Created the tree successfully using checkout-load.jmx
Starting standalone test @ 2026 Jun 30 00:04:19 GMT
Waiting for possible Shutdown/StopTestNow/HeapDump/ThreadDump message on port 4445
summary =      3 in 00:00:00 =    7.3/s Avg:   127 Min:     0 Max:   380 Err:     0 (0.00%)
Tidying up ...
... end of run
-n selects CLI mode, -t names the test plan, -l writes the result file, -e builds the dashboard after the run, and -o sets the dashboard output directory.
- Check that the JMeter process exited successfully.
$ echo $?
0
A zero exit status confirms that the CLI process completed. Failed samplers still need the dashboard statistics or .jtl rows checked before accepting the load-test result.
- List the generated dashboard directory.
$ ls checkout-dashboard
content
index.html
sbadmin2-1.0.7
statistics.json
- Check statistics.json for the sample count and error count.
$ cat checkout-dashboard/statistics.json
{
  "checkout-load" : {
    "transaction" : "checkout-load",
    "sampleCount" : 3,
    "errorCount" : 0,
    "errorPct" : 0.0,
##### snipped #####
  },
  "Total" : {
    "transaction" : "Total",
    "sampleCount" : 3,
    "errorCount" : 0,
    "errorPct" : 0.0,
##### snipped #####
  }
}
The Total row should show the expected number of samples and an error count that matches the test acceptance criteria.
- Open checkout-dashboard/index.html in a browser and confirm that the Statistics and Charts sections show the completed run.