How to enable OpenTelemetry tracing in Haystack
Distributed tracing is most useful when an AI pipeline appears in the same request tree as the application around it. OpenTelemetry gives a Haystack run a parent span and component spans that expose execution order, component identity, and timing to a compatible observability system.
Current Haystack releases provide OpenTelemetryConnector through the opentelemetry-haystack integration. The OpenTelemetry SDK provider and exporter must be configured before the connector is initialized, and the connector belongs in the pipeline without a connection to another component.
The ConsoleSpanExporter writes spans to standard output for a local smoke test. Trace attributes can contain pipeline metadata and input values, so sanitized test data belongs in the first run and content tracing should remain disabled unless prompts, documents, responses, and credentials are approved for export.
Steps to enable OpenTelemetry tracing in Haystack:
- Install the Haystack OpenTelemetry integration and SDK in the active Python environment.
$ python -m pip install \
  opentelemetry-haystack \
  opentelemetry-sdk
Collecting opentelemetry-haystack
Collecting opentelemetry-sdk
##### snipped #####
Successfully installed haystack-ai-2.31.0 opentelemetry-haystack-1.0.0 opentelemetry-sdk-1.43.0
##### snipped #####
opentelemetry-haystack provides OpenTelemetryConnector, while opentelemetry-sdk provides the provider and console exporter used for the smoke test.
Related: How to install Haystack with pip - Start haystack_opentelemetry.py with the imports, explicit content-tracing boundary, and console-exporting provider.
- haystack_opentelemetry.py
import os
import sys

os.environ["HAYSTACK_CONTENT_TRACING_ENABLED"] = "false"

from opentelemetry import trace
from opentelemetry.sdk.resources import Resource
from opentelemetry.sdk.trace import TracerProvider
from opentelemetry.sdk.trace.export import ConsoleSpanExporter, SimpleSpanProcessor

from haystack import Pipeline, component
from haystack_integrations.components.connectors.opentelemetry import OpenTelemetryConnector


resource = Resource.create({"service.name": "haystack-search"})
provider = TracerProvider(resource=resource)
provider.add_span_processor(SimpleSpanProcessor(ConsoleSpanExporter(out=sys.stdout)))
trace.set_tracer_provider(provider)
SimpleSpanProcessor and ConsoleSpanExporter make each completed span visible immediately during local development. Production trace delivery normally pairs a batching processor with the OTLP exporter that matches the collector transport.
Tool: OpenTelemetry Collector Config Generator - Add the UppercaseText test component below the tracer provider setup.
@component
class UppercaseText:
    @component.output_types(text=str)
    def run(self, text: str):
        return {"text": text.upper()}
- Enable OpenTelemetry tracing by adding an unconnected connector below the UppercaseText class.
pipeline = Pipeline()
pipeline.add_component("tracing", OpenTelemetryConnector())
Initialization enables the Haystack tracer, while the unconnected component keeps that choice in the serialized pipeline definition.
- Add the uppercase test component below the connector.
pipeline.add_component("uppercase", UppercaseText())
- Complete the program with the traced pipeline invocation below the component assembly.
result = pipeline.run({"uppercase": {"text": "trace this request"}})
provider.force_flush()
print(f"result={result['uppercase']['text']}")
- Run the traced pipeline from the directory containing haystack_opentelemetry.py.
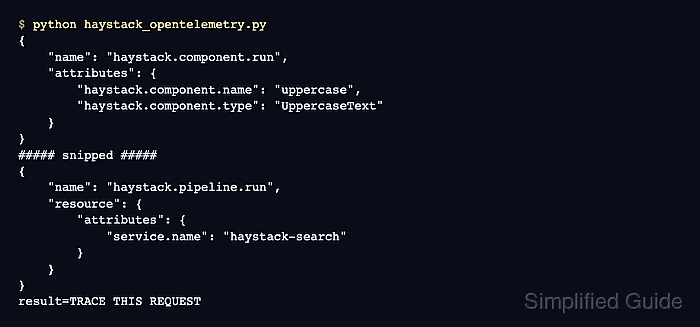
$ python haystack_opentelemetry.py { "name": "haystack.component.run", "attributes": { "haystack.component.name": "uppercase", "haystack.component.type": "UppercaseText" }, "resource": { "attributes": { "service.name": "haystack-search" } } } ##### snipped ##### { "name": "haystack.pipeline.run", "resource": { "attributes": { "service.name": "haystack-search" } } } result=TRACE THIS REQUEST - Confirm the uppercase component span is nested under the haystack.pipeline.run span for service.name=haystack-search.
The two spans share one trace ID, and the component span uses the pipeline span as its parent when the connector traces the run.