How to configure a Logstash TCP input
Configuring a Logstash tcp input gives applications, custom scripts, and network senders a direct socket for pushing events into a pipeline. It fits sources that can open a TCP connection and send one event per line without writing local files first or placing a message broker in front of Logstash.
The input runs in server mode by default and listens on the configured host and port. For JSON payloads over TCP, use the json_lines codec so each newline-terminated JSON document becomes one event, and set a codec target so sender fields do not collide with Elastic Common Schema fields at the event root.
Start with a loopback listener and a temporary stdout output before binding the input to a network interface or forwarding events to a production output. Package-based examples below use /etc/logstash/conf.d and logstash.service; expose a remote listener only after adding firewall rules and current TLS settings such as ssl_enabled, ssl_certificate, and ssl_key.
Steps to configure a Logstash TCP input:
- Check the packaged pipeline manifest.
$ sudo cat /etc/logstash/pipelines.yml
# This file is where you define your pipelines. You can define multiple.
# For more information on multiple pipelines, see the documentation:
#   https://www.elastic.co/guide/en/logstash/current/multiple-pipelines.html

- pipeline.id: main
  path.config: "/etc/logstash/conf.d/*.conf"
Use the active path.config directory when the host uses a custom pipeline ID, a different directory, or multiple pipeline manifests.
- Open a dedicated pipeline file for the listener.
$ sudoedit /etc/logstash/conf.d/25-tcp-input.conf
- Add a loopback tcp listener and a temporary stdout output.
input {
  tcp {
    id => "tcp_json_5514"
    host => "127.0.0.1"
    port => 5514
    codec => json_lines {
      target => "tcp_event"
    }
  }
}

output {
  stdout {
    id => "stdout_tcp_debug"
    codec => rubydebug
  }
}
json_lines expects one newline-terminated JSON value per event. The target setting stores sender fields under tcp_event instead of writing them at the event root.
Keep the first test bound to 127.0.0.1. If remote senders must connect, change host only after restricting access and configuring TLS with current ssl_* option names.
- Test the pipeline file with the packaged settings directory and a temporary data path.
$ sudo -u logstash /usr/share/logstash/bin/logstash \
  --path.settings /etc/logstash \
  --path.data /tmp/logstash-tcp-input-configtest \
  --config.test_and_exit \
  -f /etc/logstash/conf.d/25-tcp-input.conf
Using bundled JDK: /usr/share/logstash/jdk
Sending Logstash logs to /var/log/logstash which is now configured via log4j2.properties
##### snipped #####
Configuration OK
[2026-06-18T20:23:40,623][INFO ][logstash.runner          ] Using config.test_and_exit mode. Config Validation Result: OK. Exiting Logstash
The temporary --path.data directory must be writable by the logstash user and keeps validation away from the live service data directory.
Current package installs block superuser runs by default unless allow_superuser has been changed intentionally.
- Remove the temporary validation data path.
$ sudo rm --recursive --force /tmp/logstash-tcp-input-configtest
- Restart the Logstash service so it loads the new listener.
$ sudo systemctl restart logstash.service
Restarting Logstash briefly pauses every active pipeline while inputs reopen and outputs reconnect.
- Confirm the Logstash service returned to an active (running) state.
$ sudo systemctl status logstash.service --no-pager --lines=20 ● logstash.service - logstash Loaded: loaded (/usr/lib/systemd/system/logstash.service; enabled; preset: enabled) Active: active (running) since Thu 2026-06-18 20:23:41 UTC; 12s ago Main PID: 22164 (java) Tasks: 95 (limit: 28486) Memory: 963.1M ##### snipped ##### - Verify the tcp listener is bound to port 5514.
$ sudo ss -lntp 'sport = :5514'
State  Recv-Q Send-Q Local Address:Port Peer Address:Port Process
LISTEN 0      4096       127.0.0.1:5514      0.0.0.0:*    users:(("java",pid=22164,fd=196))
If host was changed to a service address or 0.0.0.0 for remote senders, the Local Address:Port column should show that bind target instead of 127.0.0.1:5514.
- Send a newline-terminated JSON test event to the listener.
$ printf '{"message":"tcp input validation","service":"billing","level":"info"}\n' | nc -w 2 127.0.0.1 5514Use one complete JSON object per line. If nc is not installed, use the distribution's netcat package or send the same payload from the application that will write to the listener.
Tool: JSON Validator
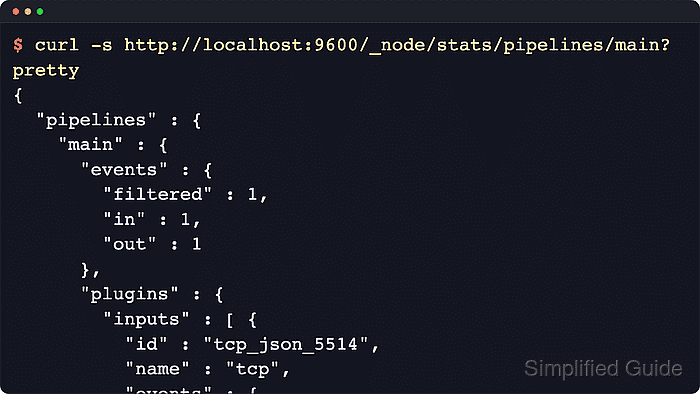
- Query the Logstash pipeline stats API and confirm the named tcp input handled the event.
$ curl -s http://localhost:9600/_node/stats/pipelines/main?pretty
{
  "status" : "green",
  ##### snipped #####
  "pipelines" : {
    "main" : {
      "events" : {
        "filtered" : 1,
        "in" : 1,
        "out" : 1
      },
      ##### snipped #####
      "plugins" : {
        "inputs" : [ {
          "id" : "tcp_json_5514",
          "name" : "tcp",
          "events" : {
            "out" : 1
          }
        } ]
      }
    }
  }
}
The explicit input id keeps the stats readable when the same pipeline has multiple listeners. If the pipeline ID is not main on your host, replace it in the API path.
- Review recent Logstash journal lines for listener startup and the decoded event.
$ sudo journalctl --unit=logstash --since "5 minutes ago" --no-pager --lines=40
Jun 18 20:23:41 logstash-01 logstash[22164]: [2026-06-18T20:23:41,100][INFO ][logstash.inputs.tcp      ][main][tcp_json_5514] Starting tcp input listener {address: "127.0.0.1:5514", ssl_enabled: false}
Jun 18 20:23:43 logstash-01 logstash[22164]: {
Jun 18 20:23:43 logstash-01 logstash[22164]:      "tcp_event" => {
Jun 18 20:23:43 logstash-01 logstash[22164]:         "message" => "tcp input validation",
Jun 18 20:23:43 logstash-01 logstash[22164]:         "service" => "billing",
Jun 18 20:23:43 logstash-01 logstash[22164]:           "level" => "info"
Jun 18 20:23:43 logstash-01 logstash[22164]:     }
Jun 18 20:23:43 logstash-01 logstash[22164]: }
With the temporary stdout output shown earlier, the journal is usually the quickest place to confirm the decoded event on package installs managed by systemd.
- Replace the temporary stdout output with the production output path after validation.
$ sudoedit /etc/logstash/conf.d/25-tcp-input.conf
Keep the tcp input block, remove the debug stdout output when it is no longer needed, then rerun the configuration test and restart logstash.service.
Related: How to configure a Logstash stdout output
Related: How to test a Logstash pipeline configuration