How to optimize Logstash pipeline performance
Optimizing a Logstash pipeline means changing worker, batch, queue, and heap settings only after the monitoring API shows where events slow down. This matters when ingest volume rises, filters become expensive, or outputs spend time waiting on Elasticsearch, Kafka, files, or another downstream service.
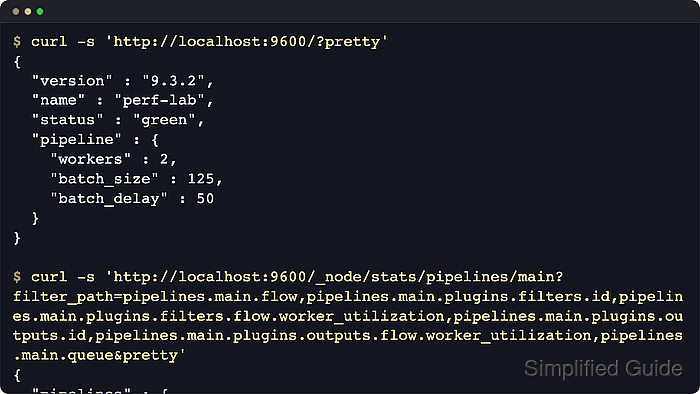
The local monitoring API returns flow metrics for worker utilization and queue back-pressure, batch metrics for actual batch fill, and plugin metrics for filter or output worker cost. Saving one stats document before and after a change keeps the comparison tied to the same pipeline ID and avoids relying on a single live screen refresh.
On package-based Linux installs managed by systemd, pipeline-specific worker and batch settings can live in /etc/logstash/pipelines.yml. Queue, API, and JVM changes normally use /etc/logstash/logstash.yml or jvm.options and require a service restart.
Steps to optimize Logstash pipeline performance:
- Check that the Logstash monitoring API is responding.
$ curl --silent --show-error 'http://localhost:9600/?pretty=true'
{
  "host" : "logstash-01",
  "version" : "9.4.2",
  "http_address" : "127.0.0.1:9600",
  "status" : "green",
  "pipeline" : {
    "workers" : 2,
    "batch_size" : 125,
    "batch_delay" : 50
  }
##### snipped #####
}
Package installs enable the API by default and usually bind it to the local interface in the 9600-9700 port range. When the API uses TLS or basic authentication, use the endpoint and credentials configured in /etc/logstash/logstash.yml.
- Save the baseline stats document for the pipeline being tuned.
$ curl --silent --show-error --output logstash-main-before.json 'http://localhost:9600/_node/stats/pipelines/main'
Replace main with the pipeline ID from /etc/logstash/pipelines.yml when the host runs multiple pipelines. Keep the full JSON file so later checks can read several fields without asking the API for a different filtered response.
- Check the baseline flow metrics.
$ jq '.pipelines.main.flow' logstash-main-before.json
{
  "worker_concurrency": {
    "current": 1.83,
    "lifetime": 1.76
  },
  "input_throughput": {
    "current": 7200.0,
    "lifetime": 6900.0
  },
  "queue_backpressure": {
    "current": 0.42,
    "lifetime": 0.39
  },
  "output_throughput": {
    "current": 7150.0,
    "lifetime": 6820.0
  },
  "filter_throughput": {
    "current": 7150.0,
    "lifetime": 6820.0
  },
  "worker_utilization": {
    "current": 91.5,
    "lifetime": 88.2
  }
}
worker_utilization near 100 means the pipeline workers are nearly saturated. Sustained queue_backpressure means inputs are spending measurable time blocked by the queue. Compare these values with the same fields after the change, not with another pipeline's values.
- Check filter plugin worker cost.
$ jq '.pipelines.main.plugins.filters' logstash-main-before.json
[
  {
    "id": "grok_checkout",
    "name": "grok",
    "flow": {
      "worker_millis_per_event": {
        "current": 0.088,
        "lifetime": 0.092
      },
      "worker_utilization": {
        "current": 63.4,
        "lifetime": 64.7
      }
    }
  }
]
A filter with much higher worker_utilization or worker_millis_per_event than its neighbors is a better tuning target than raising every pipeline setting first.
- Check output plugin worker cost.
$ jq '.pipelines.main.plugins.outputs' logstash-main-before.json
[
  {
    "id": "elasticsearch_output",
    "name": "elasticsearch",
    "flow": {
      "worker_millis_per_event": {
        "current": 0.017,
        "lifetime": 0.019
      },
      "worker_utilization": {
        "current": 12.1,
        "lifetime": 13.5
      }
    }
  }
]
Output worker cost often reflects downstream latency, indexing pressure, broker waits, or filesystem speed. If one output dominates worker time, review that destination before increasing pipeline.workers again.
- Choose the tuning change that matches the measured bottleneck.
Raise pipeline.workers when workers are saturated and the host still has CPU or I/O wait headroom. Raise pipeline.batch.size when outputs benefit from larger batches and heap headroom is available. Refactor filters when one parser or conditional consumes most worker time. Use persistent queues for durability and outage absorption, not as a raw-throughput shortcut.
- Open the pipeline manifest for the target pipeline.
$ sudoedit /etc/logstash/pipelines.yml
- Set worker and batch values for only the pipeline that needs more capacity.
- pipeline.id: main
  path.config: "/etc/logstash/conf.d/*.conf"
  pipeline.workers: 4
  pipeline.batch.size: 200
  pipeline.batch.delay: 50
pipeline.workers controls filter and output concurrency. pipeline.batch.size controls how many events each worker can collect before filters and outputs run. pipeline.batch.delay rarely needs tuning unless latency from undersized batches matters.
The inflight count is pipeline.workers multiplied by pipeline.batch.size. Moving from 2 x 125 to 4 x 200 raises the maximum in-memory events from 250 to 800, so leave enough heap for bursts and large events.
- Refactor hot filter work when plugin metrics point to parser cost.
$ sudoedit /etc/logstash/conf.d/50-main.conf
filter {
  if [event][dataset] == "app.access" {
    dissect {
      id => "dissect_app_access"
      mapping => {
        "message" => "%{[@metadata][ts]} %{[log][level]} %{[service][name]} %{msg}"
      }
    }
  }
}
Use plugin id values so the monitoring API can identify the exact filter or output instance. Fixed-format text is usually cheaper through dissect than grok, and conditionals keep expensive filters away from unrelated events.
- Enable a persistent queue only when durability or downstream outage buffering matters more than maximum throughput.
$ sudoedit /etc/logstash/logstash.yml
queue.type: persisted
queue.max_bytes: 8gb
The default memory queue is usually faster. Persistent queues write events to disk so Logstash can survive restarts and absorb output slowdowns for longer, but a full persistent queue still pushes back on inputs.
A slow disk or a full filesystem under path.queue can become the new bottleneck. Size queue.max_bytes for the outage window and leave local disk space for queue pages, checkpoints, logs, and normal host operations.
- Raise JVM heap only when the larger inflight count or plugin workload needs more memory.
$ sudoedit /etc/logstash/jvm.options.d/heap.options
-Xms4g
-Xmx4g
Elastic's current JVM guidance recommends keeping -Xms and -Xmx equal and using at least 4 GB but generally no more than 8 GB for typical ingestion hosts.
Do not size heap past physical memory. Leave room for the operating system, direct memory used by network inputs, and persistent-queue page cache when queue.type: persisted is enabled.
- Validate the packaged configuration before applying the tuning changes.
$ sudo -u logstash /usr/share/logstash/bin/logstash --path.settings /etc/logstash --path.data /tmp/logstash-configtest --config.test_and_exit
Using bundled JDK: /usr/share/logstash/jdk
Sending Logstash logs to /var/log/logstash which is now configured via log4j2.properties
##### snipped #####
Configuration OK
[2026-06-18T20:43:18,702][INFO ][logstash.runner          ] Using config.test_and_exit mode. Config Validation Result: OK. Exiting Logstash
The temporary --path.data directory must be writable by the logstash user and keeps validation away from the live service data directory in /var/lib/logstash.
Current Logstash packages default allow_superuser to false, so run packaged validation as the logstash service account unless that setting was intentionally changed.
- Restart Logstash so settings, queue, and JVM changes take effect.
$ sudo systemctl restart logstash.service
Restarting Logstash pauses every active pipeline while inputs reopen, filters compile, and outputs reconnect. Use a controlled window when upstream senders cannot buffer safely.
- Confirm that the service came back active.
$ sudo systemctl status logstash.service --no-pager --lines=0
● logstash.service - logstash
     Loaded: loaded (/usr/lib/systemd/system/logstash.service; enabled; preset: enabled)
     Active: active (running) since Thu 2026-06-18 20:47:18 UTC; 6s ago
   Main PID: 22164 (java)
      Tasks: 96 (limit: 28486)
If the unit is failed, review /var/log/logstash/logstash-plain.log or rerun the configuration test before retrying the restart.
- Save a fresh stats document under comparable traffic.
$ curl --silent --show-error --output logstash-main-after.json 'http://localhost:9600/_node/stats/pipelines/main'
Use the same pipeline ID, traffic shape, and downstream state as the baseline as closely as possible. A lower queue_backpressure or worker_utilization only matters when the workload is comparable.
- Check the flow metrics after tuning.
$ jq '.pipelines.main.flow' logstash-main-after.json
{
  "worker_concurrency": {
    "current": 2.336,
    "lifetime": 2.476
  },
  "worker_utilization": {
    "current": 58.4,
    "lifetime": 61.9
  },
  "queue_backpressure": {
    "current": 0.057,
    "lifetime": 0.071
  }
}
Lower worker utilization with lower queue back-pressure indicates the changed pipeline has more headroom for the same workload. If utilization stays high, the output destination, parser cost, host CPU, heap pressure, or disk I/O may still be the limiting layer.
- Check whether the configured batch size is being filled.
$ jq '.pipelines.main.batch' logstash-main-after.json
{
  "event_count": {
    "current": 200,
    "average": {
      "lifetime": 200
    }
  },
  "byte_size": {
    "current": 23400,
    "average": {
      "lifetime": 23400
    }
  }
}
If event_count.current and event_count.average.lifetime stay far below pipeline.batch.size during busy traffic, a larger batch limit usually adds memory pressure without improving throughput.
pipeline.batch.metrics.sampling_mode defaults to minimal. Set it in /etc/logstash/logstash.yml, not as a command-line option, only when detailed batch sampling is worth the extra measurement cost for a short tuning window.
- Remove the temporary stats documents.
$ rm logstash-main-before.json logstash-main-after.json