How to configure a Logstash Kafka input
A Logstash Kafka input consumes records from Kafka topics and turns them into pipeline events for filtering, enrichment, or indexing. It is useful when producers already write to Kafka and Logstash should join a consumer group instead of reading directly from files or sockets.
The kafka input uses bootstrap_servers to discover brokers, topics to choose the topic set, group_id to share committed offsets, and client_id to label the consumer connection in Kafka logs. When decorate_events is set to basic or extended, Logstash adds topic, partition, offset, and timestamp details under [@metadata][kafka].
Use explicit bootstrap_servers, topics, group_id, and client_id values so the consumer group and broker connections are visible during troubleshooting. For a new group_id, auto_offset_reset ⇒ “earliest” reads existing records from the beginning of each assigned partition, while secured brokers require matching security_protocol, sasl_*, and ssl_* settings with secrets kept outside plain-text pipeline files.
Steps to configure a Kafka input in Logstash:
- Check that the Kafka input is available in the current Logstash installation.
$ sudo /usr/share/logstash/bin/logstash-plugin list --verbose logstash-input-kafka
Using bundled JDK: /usr/share/logstash/jdk
logstash-integration-kafka (11.8.9)
 ├── logstash-input-kafka
 └── logstash-output-kafka
Current package releases usually show the bundled logstash-integration-kafka package. If no Kafka input appears, install logstash-input-kafka before saving a pipeline that uses it.
Related: How to install Logstash plugins
- Create a dedicated Kafka input pipeline file under /etc/logstash/conf.d/.
input {
  kafka {
    id => "kafka_logs"
    bootstrap_servers => "kafka-1.example.net:9092,kafka-2.example.net:9092"
    topics => ["logs"]
    group_id => "logstash-consumer"
    client_id => "logstash-01"
    auto_offset_reset => "earliest"
    decorate_events => "basic"

    # security_protocol => "SASL_SSL"
    # sasl_mechanism => "SCRAM-SHA-512"
    # sasl_jaas_config => "${KAFKA_SASL_JAAS_CONFIG}"
    # ssl_truststore_location => "/etc/logstash/kafka.client.truststore.p12"
    # ssl_truststore_password => "${KAFKA_TRUSTSTORE_PASSWORD}"
    # ssl_truststore_type => "PKCS12"
  }
}

output {
  stdout {
    codec => rubydebug { metadata => true }
  }
}
The temporary stdout output and metadata ⇒ true setting make validation easier, and the Kafka fields remain under [@metadata][kafka] unless a filter copies them into the event.
For a new group_id, auto_offset_reset ⇒ “earliest” can backfill the entire topic. Use latest instead when only new records should be consumed.
- Test the pipeline configuration before restarting the service.
$ sudo -u logstash /usr/share/logstash/bin/logstash \
  --path.settings /etc/logstash \
  --path.data /tmp/logstash-kafka-input-configtest \
  --config.test_and_exit \
  -f /etc/logstash/conf.d/30-kafka-input.conf
Using bundled JDK: /usr/share/logstash/jdk
[2026-06-18T17:40:25,611][INFO ][logstash.runner          ] Starting Logstash {"logstash.version" => "9.4.2"}
##### snipped #####
Configuration OK
[2026-06-18T17:40:25,969][INFO ][logstash.runner          ] Using config.test_and_exit mode. Config Validation Result: OK. Exiting Logstash
The temporary --path.data directory keeps validation away from the live service state under /var/lib/logstash. This syntax test validates pipeline and plugin settings, but Kafka reachability and broker authentication are only proven after the service starts.
- Restart the Logstash service so it loads the new Kafka input.
$ sudo systemctl restart logstash.service
A restart briefly stops active pipelines, so upstream producers may continue filling Kafka while Logstash reconnects and catches up.
- Send one known test record to the Kafka topic from a Kafka administration shell.
$ kafka-console-producer.sh --bootstrap-server kafka-1.example.net:9092 --topic logs
> kafka input live check
If a production producer is already writing to logs, use a recognizable application event instead of injecting a manual test record.
- Review recent Logstash journal lines and confirm the consumer joins the group and receives records from the topic.
$ sudo journalctl --unit=logstash.service --since "5 min ago" --no-pager
Jun 18 17:40:33 logstash-01 logstash[24831]: Subscribed to topic(s): logs
Jun 18 17:40:34 logstash-01 logstash[24831]: Successfully joined group as logstash-consumer
Jun 18 17:40:34 logstash-01 logstash[24831]:                     "topic" => "logs",
Jun 18 17:40:34 logstash-01 logstash[24831]:            "consumer_group" => "logstash-consumer",
Jun 18 17:40:34 logstash-01 logstash[24831]:        "message" => "kafka input live check"
If the service writes to files instead of the system journal, check the plain Logstash log under /var/log/logstash/ for the same consumer-group and event output lines.
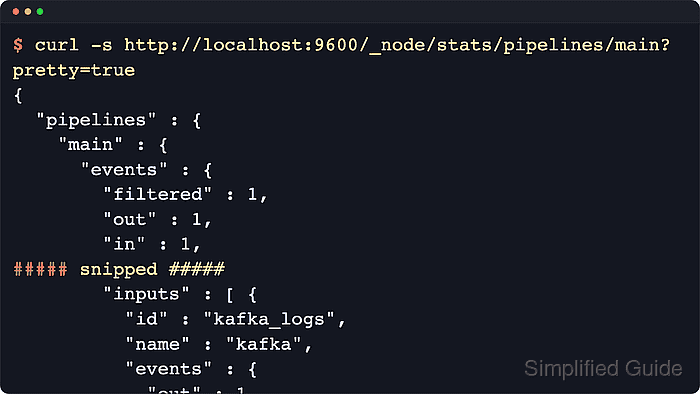
- Query the Logstash monitoring API and confirm the kafka_logs input shows rising event counters.
$ curl -s http://localhost:9600/_node/stats/pipelines/main?pretty=true
{
  "pipelines" : {
    "main" : {
      "events" : {
        "in" : 1,
        "out" : 1,
        "filtered" : 1,
        "queue_push_duration_in_millis" : 0
      },
      "plugins" : {
        "inputs" : [ {
          "id" : "kafka_logs",
          "name" : "kafka",
          "events" : {
            "out" : 1,
            "queue_push_duration_in_millis" : 0
          }
        } ]
      }
    }
  }
}
Increasing in and out counters confirm that the input is consuming records and the pipeline is forwarding them to the configured output. If /etc/logstash/logstash.yml changes api.http.host, api.http.port, or API authentication settings, query that endpoint instead.