How to aggregate a Spark DataFrame with groupBy
Summarized DataFrames are a common handoff point between raw Spark rows and reporting tables, validation totals, or feature inputs. DataFrame.groupBy() groups rows by key columns so aggregate functions can calculate counts, sums, and averages at the grain the job needs.
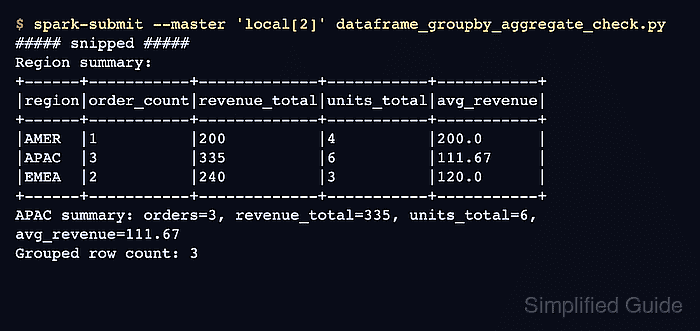
In PySpark, groupBy() returns a GroupedData object. Chaining agg() with expressions from pyspark.sql.functions keeps each metric name explicit through alias(), which makes the output easier to check before a write or join.
Local sample rows are enough to prove the aggregation shape before replacing them with a file or table source. Use a deterministic orderBy() before show() when the printed output is used as a check, because grouped output does not need to follow input order.
Related: How to run PySpark locally
Related: How to create a Spark DataFrame
Related: How to select and filter a Spark DataFrame
Related: How to write partitioned data with Spark
Steps to aggregate a Spark DataFrame with groupBy in PySpark:
- Create a PySpark aggregation check script.
$ vi dataframe_groupby_aggregate_check.py
- Import the Spark session and SQL functions.
from pyspark.sql import SparkSession, functions as F
- Build the Spark session.
spark = (
    SparkSession.builder
    .appName("sg-dataframe-groupby-aggregate-check")
    .config("spark.sql.shuffle.partitions", "2")
    .config("spark.ui.showConsoleProgress", "false")
    .getOrCreate()
)
spark.sparkContext.setLogLevel("ERROR")
A small spark.sql.shuffle.partitions value keeps the local check compact. Use a value sized for the cluster and input volume in production jobs.
- Create a sample orders DataFrame.
orders = spark.createDataFrame(
    [
        ("ORD-1001", "APAC", "web", 120, 2),
        ("ORD-1002", "APAC", "web", 80, 1),
        ("ORD-1003", "APAC", "partner", 135, 3),
        ("ORD-1004", "EMEA", "web", 90, 1),
        ("ORD-1005", "EMEA", "partner", 150, 2),
        ("ORD-1006", "AMER", "web", 200, 4),
    ],
    ["order_id", "region", "channel", "amount", "quantity"],
)
The sample rows repeat region and channel values so both single-column and multi-column grouping produce visible groups.
- Aggregate orders by region.
region_summary = (
    orders
    .groupBy("region")
    .agg(
        F.count("*").alias("order_count"),
        F.sum("amount").alias("revenue_total"),
        F.sum("quantity").alias("units_total"),
        F.round(F.avg("amount"), 2).alias("avg_revenue"),
    )
    .orderBy("region")
)
groupby() is accepted as an alias, but groupBy() matches the PySpark API name. alias() gives each aggregate column a stable output name.
- Aggregate orders by region and channel when a finer grain is needed.
channel_summary = (
    orders
    .groupBy("region", "channel")
    .agg(
        F.count("*").alias("order_count"),
        F.sum("amount").alias("revenue_total"),
    )
    .orderBy("region", "channel")
)
- Print the aggregate summaries and APAC checks.
print("Region summary:")
region_summary.show(truncate=False)

print("Region and channel summary:")
channel_summary.show(truncate=False)

apac = region_summary.where(F.col("region") == "APAC").collect()[0]
print(
    "APAC summary: "
    f"orders={apac['order_count']}, "
    f"revenue_total={apac['revenue_total']}, "
    f"units_total={apac['units_total']}, "
    f"avg_revenue={apac['avg_revenue']}"
)
print(f"Grouped row count: {region_summary.count()}")

spark.stop()
- Run the script in local mode.
$ spark-submit --master 'local[2]' dataframe_groupby_aggregate_check.py
##### snipped #####
Region summary:
+------+-----------+-------------+-----------+-----------+
|region|order_count|revenue_total|units_total|avg_revenue|
+------+-----------+-------------+-----------+-----------+
|AMER  |1          |200          |4          |200.0      |
|APAC  |3          |335          |6          |111.67     |
|EMEA  |2          |240          |3          |120.0      |
+------+-----------+-------------+-----------+-----------+

Region and channel summary:
+------+-------+-----------+-------------+
|region|channel|order_count|revenue_total|
+------+-------+-----------+-------------+
|AMER  |web    |1          |200          |
|APAC  |partner|1          |135          |
|APAC  |web    |2          |200          |
|EMEA  |partner|1          |150          |
|EMEA  |web    |1          |90           |
+------+-------+-----------+-------------+

APAC summary: orders=3, revenue_total=335, units_total=6, avg_revenue=111.67
Grouped row count: 3
The APAC line confirms the known group totals from the sample rows. The grouped row count confirms that the region-level output has one row for each distinct region.
- Remove the proof script when it is not part of the application code.
$ rm dataframe_groupby_aggregate_check.py