A time-domain trace can hide repeating components when several oscillations overlap. A frequency-domain view separates those components into bins, making the strongest periodic component visible without changing the original samples.
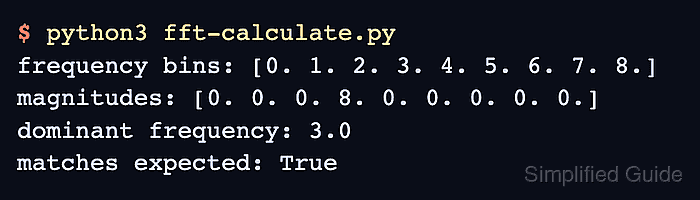
For real-valued input, np.fft.rfft() returns only the non-negative half of the discrete Fourier transform. np.fft.rfftfreq() produces the matching bin centers when it receives the same sample count and the reciprocal of the sample rate as its spacing.
Frequency resolution equals the sample rate divided by the sample count, so a one-second record produces bins spaced one hertz apart. Measured input must be evenly sampled, and sample_rate must match the acquisition rate for the reported frequencies to remain meaningful.
Related: Create linearly spaced values
Related: Create an array
Steps to calculate a real-input FFT with NumPy:
- Create fft-calculate.py with the sampling configuration and two-tone signal.
- fft-calculate.py
import numpy as np

sample_rate = 32
duration_seconds = 1
sample_count = sample_rate * duration_seconds
time = np.arange(sample_count) / sample_rate
signal = (
    np.sin(2 * np.pi * 5 * time)
    + 0.25 * np.sin(2 * np.pi * 9 * time)
)
- Append the FFT analysis section to fft-calculate.py.
- fft-calculate.py
spectrum = np.fft.rfft(signal)
frequencies = np.fft.rfftfreq(signal.size, d=1 / sample_rate)
magnitudes = np.abs(spectrum)
dominant_index = np.argmax(magnitudes[1:]) + 1
dominant_frequency = frequencies[dominant_index]
Starting np.argmax() at index 1 excludes the zero-frequency or DC bin from the peak search.
- Append the expected-frequency check to fft-calculate.py.
- fft-calculate.py
expected_frequency = 5.0
matches_expected = np.isclose(dominant_frequency, expected_frequency)

print(f"frequency resolution: {frequencies[1] - frequencies[0]:.1f} Hz")
print(f"dominant frequency: {dominant_frequency:.1f} Hz")
print(f"dominant magnitude: {magnitudes[dominant_index]:.1f}")
print(f"matches expected: {matches_expected}")

if not matches_expected:
    raise RuntimeError("dominant frequency did not match the known signal")
- Run the completed fft-calculate.py script.
$ python3 fft-calculate.py
frequency resolution: 1.0 Hz
dominant frequency: 5.0 Hz
dominant magnitude: 16.0
matches expected: True

Mohd Shakir Zakaria is a cloud architect with deep roots in software development and open-source advocacy. Certified in AWS, Red Hat, VMware, ITIL, and Linux, he specializes in designing and managing robust cloud and on-premises infrastructures.


