Realistic user pacing in JMeter comes from pauses between business actions, not only from the number of virtual users. Adding think time keeps a thread from immediately starting the next request after a response returns, which makes a web or API workload closer to how people browse, read, search, and submit forms.
A JMeter timer under a Thread Group, controller, or sampler affects the samplers in that scope. A Uniform Random Timer is a common fit for think time because it combines a minimum delay with a random extra delay, so virtual users do not all pause for exactly the same number of milliseconds.
Think-time timers slow sampler starts; they do not hold server responses open or enforce an aggregate request rate. Use a throughput timer when the requirement is a fixed request rate, and keep setup, login, or cleanup samplers outside the think-time scope when those actions should not be paced like normal user actions.
Steps to add think time in JMeter:
- Open the test plan in the JMeter GUI and select the Thread Group or controller that contains the requests to pace.
- Add the timer from Add → Timer → Uniform Random Timer.
- Name the timer for the user action it represents.
Name: Think time - checkout pause
- Enter the variable pause window.
Random Delay Maximum: 500
Constant Delay Offset: 1000
JMeter adds the random delay to the offset. These values make each affected thread wait from about 1000 to 1500 milliseconds before the next sampler starts.
- Keep the timer under only the requests that should receive the pause.
Timers are processed before each sampler in their scope. Add the timer as a child of one sampler when only that sampler should wait, or place it under a controller when every child sampler should use the same think-time rule.
- Save the test plan with the timer in place.
think-time-demo.jmx
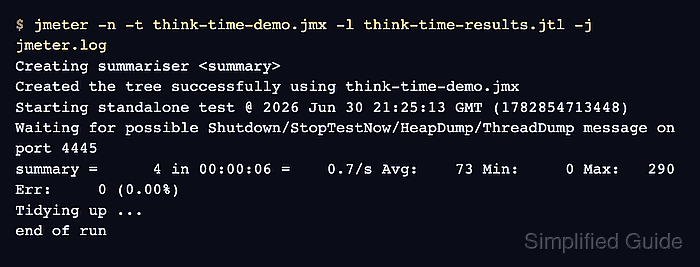
- Run the saved plan in non-GUI mode with a fresh result file.
$ jmeter -n -t think-time-demo.jmx -l think-time-results.jtl -j jmeter.log
Creating summariser <summary>
Created the tree successfully using think-time-demo.jmx
Starting standalone test @ 2026 Jun 30 21:25:13 GMT (1782854713448)
Waiting for possible Shutdown/StopTestNow/HeapDump/ThreadDump message on port 4445
summary =      4 in 00:00:06 =    0.7/s Avg:    73 Min:     0 Max:   290 Err:     0 (0.00%)
Tidying up ...
... end of run
-n runs JMeter without the GUI, -t selects the saved plan, -l writes sampler results, and -j writes the run log.
Related: How to run a JMeter test from the command line - Check the result timestamps for the expected spacing.
$ cat think-time-results.jtl
timeStamp,elapsed,label,responseCode,responseMessage,threadName,dataType,success,failureMessage,bytes,sentBytes,grpThreads,allThreads,URL,Latency,IdleTime,Connect
1782854714938,290,Checkout page request,200,OK,Checkout users 1-1,text,true,,16,0,1,1,null,0,0,0
1782854716693,1,Checkout page request,200,OK,Checkout users 1-1,text,true,,16,0,1,1,null,0,0,0
1782854717943,0,Checkout page request,200,OK,Checkout users 1-1,text,true,,16,0,1,1,null,0,0,0
1782854719254,1,Checkout page request,200,OK,Checkout users 1-1,text,true,,16,0,1,1,null,0,0,0
JMeter records sample timestamps as start times. The observed start gaps here are 1755 ms, 1250 ms, and 1311 ms; the gap includes the previous sampler's elapsed time plus the next timer delay.

Mohd Shakir Zakaria is a cloud architect with deep roots in software development and open-source advocacy. Certified in AWS, Red Hat, VMware, ITIL, and Linux, he specializes in designing and managing robust cloud and on-premises infrastructures.


