Database checks in JMeter need a saved connection pool before a sampler can run SQL. A JDBC test plan keeps the database URL, driver class, credential source, query, and result check in one .jmx file so the same database smoke test can be repeated from the GUI or from a command-line run.
JDBC Connection Configuration creates the named pool, and JDBC Request uses that pool name when it executes the query. Keeping the pool name short and specific, such as orders_pool, makes the sampler easy to audit and prevents a later database sampler from accidentally pointing at a different connection.
Start with a one-user read-only query before adding load. The sample plan uses a disposable result value and a JSR223 Assertion so a successful row means JMeter connected, ran SQL, captured the result variable, and checked the expected value without storing a real database password in the test plan.
Steps to create a JMeter JDBC test plan:
- Add the database JDBC driver to JMeter before opening the plan.
Driver jar: h2.jar
JMeter library path: $JMETER_HOME/lib/h2.jar
Use the driver jar and driver class for the target database. A missing driver usually appears as Cannot load JDBC driver class when the sampler runs.
Related: How to add a JDBC driver to JMeter - Open the test plan in the JMeter GUI.
- Add a Thread Group for the database smoke run.
Name: JDBC smoke users
Number of Threads: 1
Ramp-up period: 1
Loop Count: 1
Keep the first database run to one user and one loop so connection, credential, and query errors appear before load is added.
Related: How to configure a thread group in JMeter - Add JDBC Connection Configuration under the Thread Group.
Menu path: Add -> Config Element -> JDBC Connection Configuration
- Set the JDBC connection pool fields.
Name: Sample JDBC connection
Variable Name for created pool: orders_pool
Max Number of Connections: 0
Max Wait (ms): 10000
Validation Query: select 1
Database URL: jdbc:h2:mem:orders_smoke;DB_CLOSE_DELAY=-1
JDBC Driver class: org.h2.Driver
Username: sa
Password: (blank)
For a shared database, replace the URL, driver class, username, and password with the target database values. Prefer JMeter properties such as ${__P(db.user)} and ${__P(db.password)} instead of saving real credentials directly in the .jmx file.
- Add a JDBC Request sampler under the same Thread Group.
Menu path: Add -> Sampler -> JDBC Request
- Configure the sampler to use the same pool name.
Name: Read order count
Variable Name of Pool declared in JDBC Connection Configuration: orders_pool
Query Type: Select Statement
Query: SELECT 42 AS ORDER_COUNT
Variable names: order_count
The sampler pool name must match the connection configuration's orders_pool value exactly. Variable names stores the first returned row as order_count_1, which can be checked by an assertion or a later sampler.
- Add a JSR223 Assertion under the JDBC Request sampler.
if (vars.get('order_count_1') != '42') {
    AssertionResult.setFailure(true)
    AssertionResult.setFailureMessage('Expected order_count_1=42 but got ' + vars.get('order_count_1'))
}
The assertion turns an unexpected query result into a failed sampler instead of only proving that the database returned some row.
- Save the test plan.
jdbc-smoke.jmx
- Run the saved JDBC test plan in CLI mode.
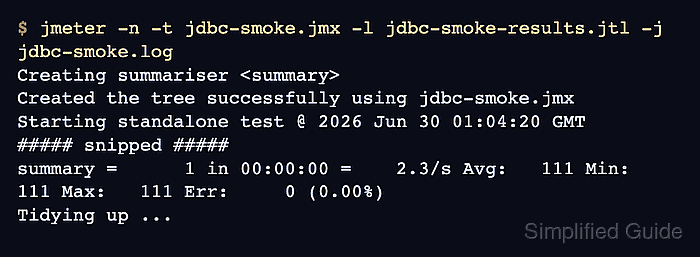
$ jmeter -n -t jdbc-smoke.jmx -l jdbc-smoke-results.jtl -j jdbc-smoke.log
Creating summariser <summary>
Created the tree successfully using jdbc-smoke.jmx
Starting standalone test @ 2026 Jun 30 01:04:20 GMT
Waiting for possible Shutdown/StopTestNow/HeapDump/ThreadDump message on port 4445
summary =      1 in 00:00:00 =    2.3/s Avg:   111 Min:   111 Max:   111 Err:     0 (0.00%)
Tidying up ...
... end of run
-n runs the saved plan without the GUI, -t selects the .jmx file, -l writes sample results, and -j writes the run log.
Related: How to run a JMeter test from the command line - Check the .jtl result file for a successful JDBC sample.
$ cat jdbc-smoke-results.jtl
timeStamp,elapsed,label,responseCode,responseMessage,threadName,dataType,success,failureMessage,bytes,sentBytes,grpThreads,allThreads,URL,Latency,IdleTime,Connect
1782781461120,111,Read order count,200,OK,JDBC smoke users 1-1,text,true,,15,0,1,1,null,106,0,105
The success column should show true for the Read order count row. A failed assertion or connection error changes the row to false and writes the reason to the failure message or run log.

Mohd Shakir Zakaria is a cloud architect with deep roots in software development and open-source advocacy. Certified in AWS, Red Hat, VMware, ITIL, and Linux, he specializes in designing and managing robust cloud and on-premises infrastructures.


