Adding a Grafana dashboard variable creates a dropdown that swaps a query value without editing each panel. It fits dashboards that need to move between services, regions, hosts, or other repeated labels while keeping one saved layout.

Grafana stores variables with the dashboard and displays visible variables above the panels by default. Query variables fetch their options from a selected data source, while panel queries refer to the variable name with syntax such as $region or ${region}.
A TestData query of * returns lettered values from A through H, which makes a variable easy to verify without external metrics. Use the same editor flow with Prometheus, InfluxDB, or another data source, but replace the variable query with that data source's label, tag, or field lookup.
Steps to add a variable to a Grafana dashboard:
- Open the dashboard that should receive the dropdown.
- Click Edit in the dashboard toolbar.
The dashboard needs edit permission. View-only users can change existing variable values but cannot save a new variable.
- Click Add variable in the dashboard editor.
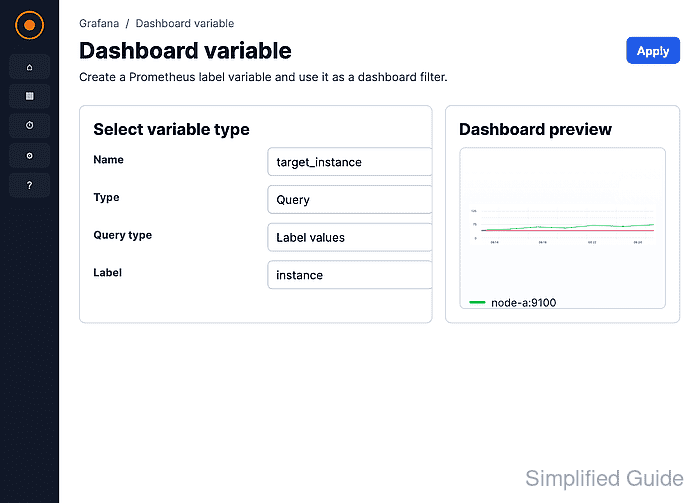
- Select Query as the variable type.
Query variables ask a data source for values. Use Custom only when the allowed values are a fixed list.
- Enter the variable name.
region
Use a short identifier without spaces because panel queries reference the value as $region or ${region}.
- Enter the dashboard label.
Region
The label is the text shown beside the dropdown. If it is left blank, Grafana shows the variable name.
- Select the target data source.
- Enter the variable query.
*

The TestData data source returns top-level values A through H for *. Other data sources use their own query syntax, such as a label-values query for Prometheus or a tag query for InfluxDB.
- Set Sort to Alphabetical (asc).
- Set Refresh to On dashboard load.
Use On time range change only when the variable query depends on the dashboard time range.
- Click Preview.
- Confirm the expected values appear in Preview of values.
- Close the variable editor.
- Save the dashboard.
- Edit the panel that should use the new variable.
- Add the variable to the panel query.
region=$region

The screenshot uses the TestData Labels field. In a metric query, place the variable where the data source expects the filter value, such as a label matcher, tag value, or field predicate.
- Save the panel.
- Save the dashboard.
- Open the variable dropdown and select another value.
- Confirm the panel refreshes with the selected value.
If the panel shows No data, check the variable value, dashboard time range, and panel request in Query inspector.
Related: How to use Grafana query inspector

Mohd Shakir Zakaria is a cloud architect with deep roots in software development and open-source advocacy. Certified in AWS, Red Hat, VMware, ITIL, and Linux, he specializes in designing and managing robust cloud and on-premises infrastructures.


