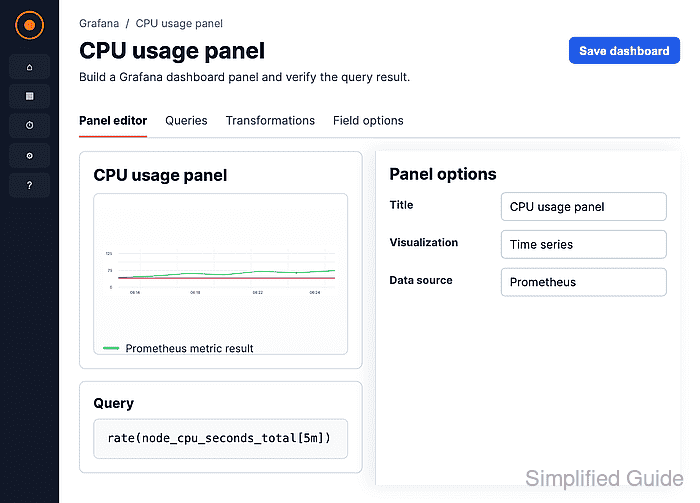
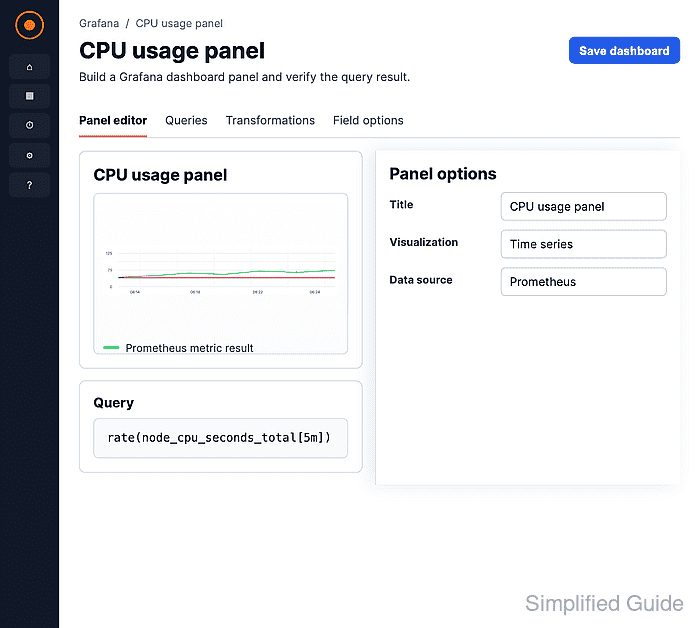
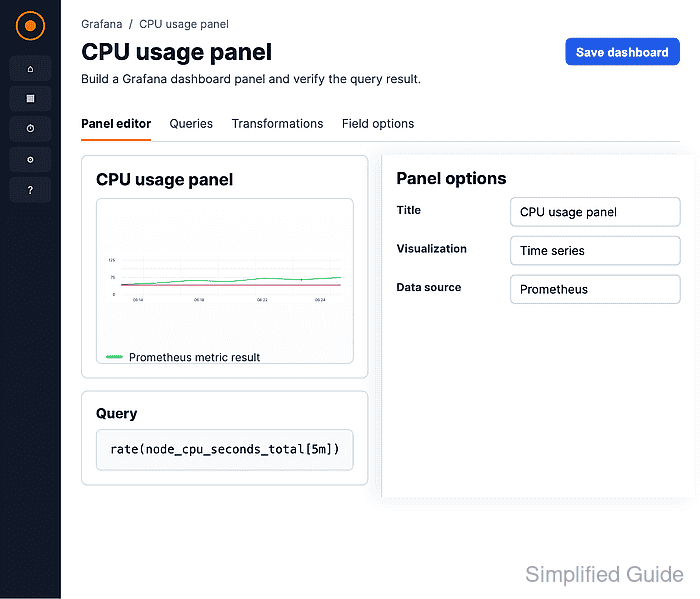
A time series panel in Grafana plots numeric measurements against time for host metrics, request rates, latency, queue depth, and other values that change over a selected range. Creating the panel from a dashboard lets an operator choose the data source, query, visualization, title, and dashboard save target in one UI flow.

The panel editor needs a data source that returns a time field and at least one numeric field. Prometheus, InfluxDB, and TestData can all supply time-series data; TestData is useful in a lab because it generates sample measurements without an external service.
Saving the dashboard stores both the panel configuration and the dashboard title or folder selection. After the save completes, the finished dashboard should show the panel title, time range, legend, and a rendered line instead of a No data or query error state.
Steps to create a Grafana time series panel:
- Open Dashboards and choose New → New dashboard.
- Click Panel under Add.
Panel adds an empty dashboard panel before the query editor opens.
- Enter a short panel name in the Title field.
Use a metric-specific title such as CPU usage trend so dashboard users can identify the line without opening the query.
- Click Configure visualization.
- Select the data source in the Queries tab.

The screenshot uses TestData with the Random Walk scenario. For production dashboards, select the existing Prometheus, InfluxDB, or other time-series data source that already passes its connection test.
Related: How to test a Grafana data source - Confirm the query returns time-series data.
The Time series visualization needs rows ordered by time and at least one numeric value field. Use Query inspector when the preview shows an empty panel or unexpected fields.
Related: How to use Grafana query inspector - Select Time series from Suggestions or All visualizations.
- Click Save in the panel editor to open the dashboard save dialog.
- Enter the dashboard title and click Save.
Select a folder when the dashboard should live outside the default Dashboards folder.
- Open the saved dashboard and confirm the time series panel renders a line, legend, title, and selected time range.
Open the panel query again if the dashboard shows No data, a query error, or the wrong visualization type.
Related: How to troubleshoot a Grafana panel with no data

Mohd Shakir Zakaria is a cloud architect with deep roots in software development and open-source advocacy. Certified in AWS, Red Hat, VMware, ITIL, and Linux, he specializes in designing and managing robust cloud and on-premises infrastructures.


