Building a Grafana dashboard from InfluxDB SQL data turns measurements from an InfluxDB 3 database into panels that dashboard viewers can refresh, share, and inspect. Host, application, and sensor metrics fit this pattern when they already have a timestamp column and numeric fields.

The InfluxDB data source must be configured with SQL as its query language before the dashboard panel opens the SQL query editor. In that editor, Builder mode can assemble simple queries from tables and columns, while Code mode gives direct control over macros, grouping, and ordering.
A time series panel needs a timestamp column and at least one numeric value column. Keep the dashboard time range in the query with $__timeFilter(time) so Grafana sends only the selected window to InfluxDB and redraws the panel when viewers change the time picker.
Steps to build a Grafana dashboard from InfluxDB SQL data:
- Open Dashboards and create a new dashboard.
- Click Panel in the Add drawer.
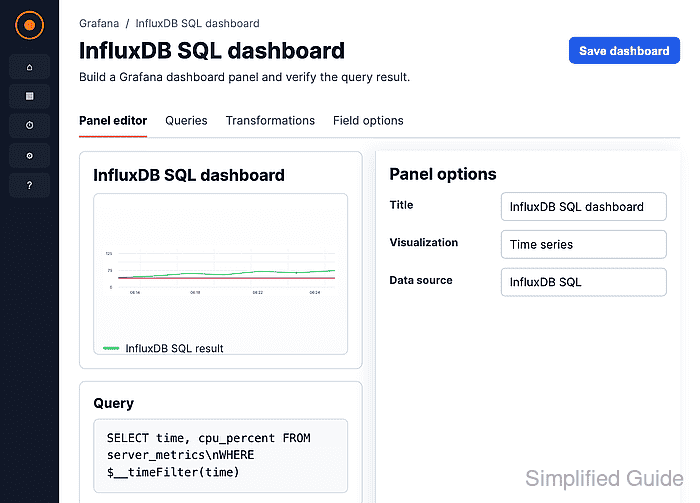
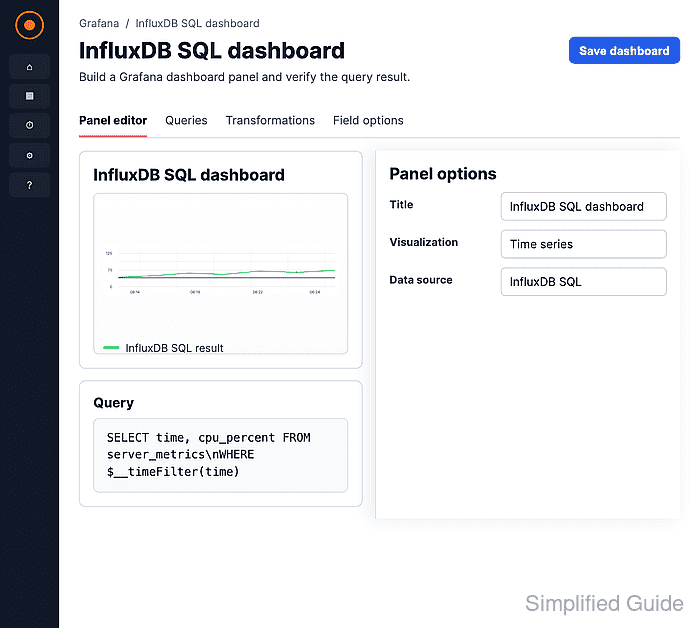
The Panel tile opens the panel editor where the query, visualization, title, and field options are configured.
- Select the InfluxDB SQL data source in the Queries tab.
Use the data source whose Query language is SQL and whose Database points to the InfluxDB 3 database or bucket that contains the measurement.
- Set Format to Time series and switch the editor to Code mode.
- Enter a SQL query that returns a time column and the value to graph.
SELECT time, host, cpu_percent
FROM server_metrics
WHERE $__timeFilter(time)
ORDER BY time
Replace server_metrics, host, and cpu_percent with the table, tag column, and field column in the target database. $__timeFilter(time) expands to the active dashboard time range.
- Click Run query and confirm that the preview draws the InfluxDB series.
If the panel shows No data, widen the dashboard time range first, then check the table name, field names, token permissions, and query language.
Related: How to use Grafana query inspector - Set the panel title and display options that describe the metric.
Units such as percent, bytes, or requests/sec make legends and tooltips readable for dashboard viewers.
- Save the panel.
- Save the dashboard with a name that identifies the InfluxDB source and metric group.
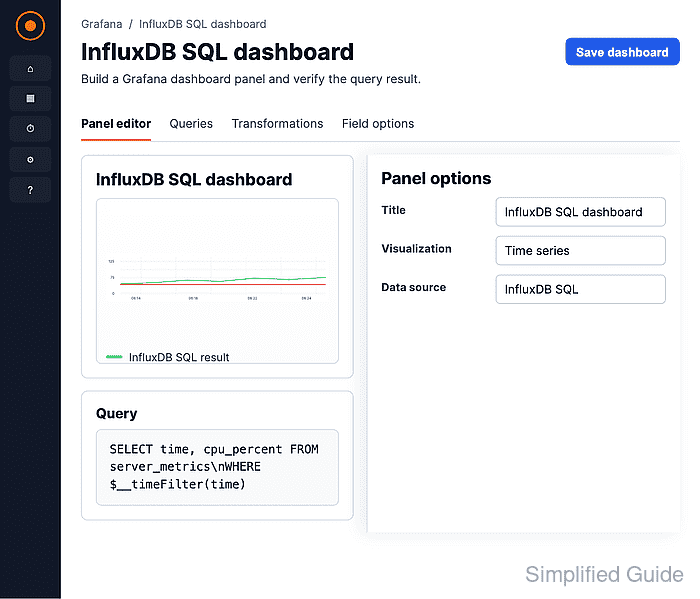
- Open the saved dashboard and confirm the panel renders data over the selected time range.

Mohd Shakir Zakaria is a cloud architect with deep roots in software development and open-source advocacy. Certified in AWS, Red Hat, VMware, ITIL, and Linux, he specializes in designing and managing robust cloud and on-premises infrastructures.


