Spark exposes runtime counters and gauges through the web UI process that serves application, master, and worker pages. Adding the PrometheusServlet sink publishes those metrics as Prometheus text so a scraper can collect driver, executor, scheduler, storage, and JVM signals from a Spark UI endpoint.
The Spark metrics system reads /$SPARK_HOME/conf/metrics.properties by default, and the same settings can be supplied from another file with spark.metrics.conf. A custom file path is useful for application-level rollout because it avoids changing a shared Spark installation while still attaching the servlet to the running application's UI.
Prometheus should reach only the UI endpoint that is meant to be scraped. Keep Spark web UIs behind a private network, authenticated proxy, or cluster access control, and use a stable metrics namespace when repeated application IDs would make dashboards and alert rules change between runs.
Related: How to open the Apache Spark web UI
Related: How to configure Spark defaults
Related: How to check Spark application status
Steps to enable Spark Prometheus metrics:
- Create a directory for the Spark metrics configuration file.
$ sudo mkdir -p /etc/spark
- Open the metrics configuration file.
$ sudoedit /etc/spark/metrics.properties
- Add the Prometheus servlet sink and optional JVM source.
*.sink.prometheusServlet.class=org.apache.spark.metrics.sink.PrometheusServlet
*.sink.prometheusServlet.path=/metrics/prometheus
*.source.jvm.class=org.apache.spark.metrics.source.JvmSource
The servlet path above exposes the driver application endpoint at /metrics/prometheus/. Standalone masters also expose /metrics/master/prometheus/ and /metrics/applications/prometheus/ when the same sink is configured for those processes.
- Create a temporary local Spark application for endpoint validation.
$ cat > /tmp/sg-prometheus-metrics.py <<'PY'
from pyspark.sql import SparkSession
import time

spark = SparkSession.builder.appName("sg-prometheus-metrics").getOrCreate()
spark.range(1000).count()
time.sleep(600)
spark.stop()
PY
Use an existing long-running Spark application instead when one is already available. The temporary application only keeps the driver UI alive long enough to confirm the metrics endpoint.
- Submit the Spark application with the metrics file.
$ spark-submit \
  --conf spark.metrics.conf=/etc/spark/metrics.properties \
  --conf 'spark.metrics.namespace=${spark.app.name}' \
  --conf spark.ui.port=4040 \
  /tmp/sg-prometheus-metrics.py
Leave this process running while checking the endpoint from another terminal. Put the same spark.metrics.conf and spark.metrics.namespace settings in spark-defaults.conf when every submitted application should use them.
Related: How to configure Spark defaults - Request the Spark driver Prometheus endpoint.
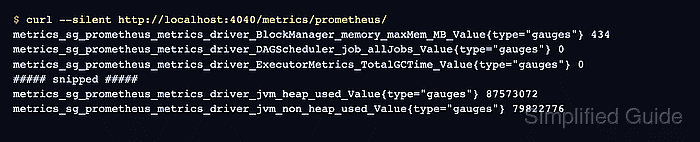
$ curl --silent http://localhost:4040/metrics/prometheus/
metrics_sg_prometheus_metrics_driver_BlockManager_memory_maxMem_MB_Value{type="gauges"} 434
metrics_sg_prometheus_metrics_driver_DAGScheduler_job_allJobs_Value{type="gauges"} 0
metrics_sg_prometheus_metrics_driver_ExecutorMetrics_TotalGCTime_Value{type="gauges"} 0
##### snipped #####
metrics_sg_prometheus_metrics_driver_jvm_heap_used_Value{type="gauges"} 87573072
metrics_sg_prometheus_metrics_driver_jvm_non_heap_used_Value{type="gauges"} 79822776
The metric names should contain the configured namespace, component name, and metric source. A page that still says Spark is starting up is the UI warmup page, not the servlet output; retry after the driver finishes starting.
- Add the Spark UI endpoint to the Prometheus scrape configuration.
scrape_configs:
  - job_name: spark-driver
    metrics_path: /metrics/prometheus/
    static_configs:
      - targets:
          - localhost:4040
        labels:
          app: sg-prometheus-metrics
Use the real Spark UI host and port in Prometheus, not necessarily localhost:4040. For executors visible through the driver UI, Spark also exposes /metrics/executors/prometheus/ when spark.ui.prometheus.enabled remains enabled.
Tool: Prometheus Scrape Config Generator - Stop the temporary Spark application in the terminal running spark-submit.
Leave a real Spark application running if Prometheus will continue scraping that application.
- Remove the temporary validation script when it is no longer needed.
$ rm /tmp/sg-prometheus-metrics.py
Keep /etc/spark/metrics.properties in place if active Spark applications will continue using it.

Mohd Shakir Zakaria is a cloud architect with deep roots in software development and open-source advocacy. Certified in AWS, Red Hat, VMware, ITIL, and Linux, he specializes in designing and managing robust cloud and on-premises infrastructures.


