How to view Playwright traces
Playwright trace files turn a completed browser test run into a navigable replay. Opening the Trace Viewer is useful when a failed or flaky test needs the action timeline, page snapshot, request, console, and source details in one place.
The Node.js Playwright CLI opens a local viewer from a saved trace.zip archive. That archive usually comes from a focused run with --trace on, a failure-retention setting, or a CI artifact collected after a retry.
Trace archives can include DOM snapshots, screenshots, request URLs, headers, and console text from the run. Open them on a trusted workstation, and treat shared trace files like other internal test artifacts when they come from protected environments.
Related: How to record Playwright traces
Related: How to retain Playwright traces on failure
Related: How to debug Playwright tests
Steps to view Playwright traces:
- Open a terminal at the Playwright project root.
$ cd ~/projects/playwright-demo
- Locate the saved trace archive.
$ find test-results -name trace.zip
test-results/tests-home-home-page-shows-ready-state-chromium/trace.zip
Use the path from the failed test output, CI artifact, or HTML report when the trace is already known.
- Open the trace archive in Trace Viewer.
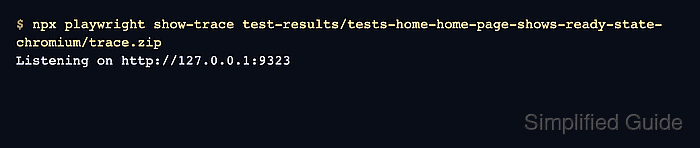
$ npx playwright show-trace test-results/tests-home-home-page-shows-ready-state-chromium/trace.zip
Listening on http://127.0.0.1:9323
The viewer process keeps running while the browser tab is open. If port 9323 is busy, Playwright may choose another local port.
- Select the action that needs inspection in the Actions panel.
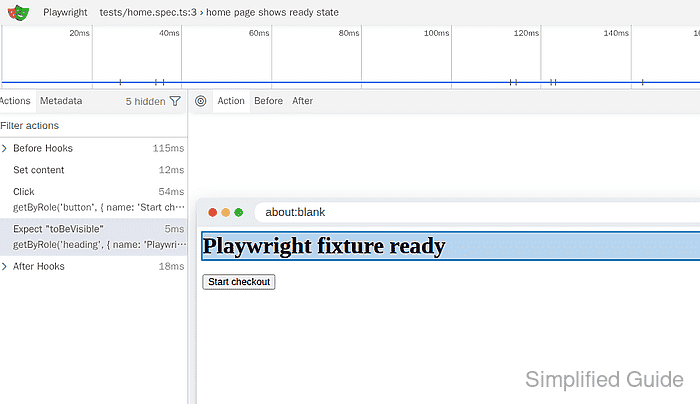
The Before and After tabs show the page snapshot around the selected action. The Call, Log, Console, Network, and Source tabs show supporting details for the same action.
- Stop the local viewer after finishing the inspection.
Press Ctrl+C in the terminal that is running npx playwright show-trace.