Browser test failures are easier to diagnose when the failing action is visible, paused, and tied to the test code that triggered it. Playwright Test debug mode opens a headed browser with Playwright Inspector so a developer can step through the run instead of reading only the final assertion message.
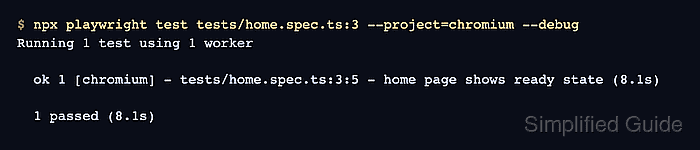
A narrow debug run keeps the Inspector tied to the failure because the session is interactive and waits for human input. Use one test file, one line number, and one browser project so the paused browser state belongs to the behavior being investigated.
The --debug flag configures headed mode, one worker, no timeout, and first-failure stopping. Keep it on a developer workstation or another graphical environment, then use DEBUG=pw:api logs or a trace from the same focused target when the problem needs a shareable artifact.
Related: How to run specific Playwright tests
Related: How to run Playwright tests in headed mode
Related: How to record Playwright traces
Steps to debug Playwright tests:
- Open a terminal at the Playwright project root.
$ cd ~/projects/playwright-demo
- List the focused test target before starting the debugger.
$ npx playwright test tests/home.spec.ts:3 --project=chromium --list
Listing tests:
  [chromium] › home.spec.ts:3:5 › home page shows ready state
Total: 1 test in 1 file
Replace the file path, line number, and project with the test that fails locally. Use a line inside the test body or title block so Playwright selects one test instead of the full file.
- Start the selected test in debug mode.
$ npx playwright test tests/home.spec.ts:3 --project=chromium --debug
Running 1 test using 1 worker
The Playwright Inspector and a headed browser open during this command. The terminal does not print the final pass or fail line until the paused run is resumed or stopped.
- Step through the paused run in Playwright Inspector until the failing action is visible.
Use the toolbar to resume, pause, or step over actions. Use Pick Locator or the locator field when the failure points to an ambiguous selector.
- Run the same target with verbose API logs when the Inspector state is not enough.
$ DEBUG=pw:api npx playwright test tests/home.spec.ts:3 --project=chromium
Running 1 test using 1 worker
  pw:api => browserType.launch started
  pw:api <= browserType.launch succeeded
##### snipped #####
  pw:api waiting for getByRole('heading', { name: 'Playwright fixture ready' })
  pw:api <= expect.toBeVisible succeeded
  ✓  1 [chromium] › tests/home.spec.ts:3:5 › home page shows ready state (120ms)

  1 passed (872ms)
On PowerShell, set $env:DEBUG="pw:api" before running the test command.
- Rerun the focused test without debug mode after updating the selector, wait, or assertion.
$ npx playwright test tests/home.spec.ts:3 --project=chromium
Running 1 test using 1 worker

  ✓  1 [chromium] › tests/home.spec.ts:3:5 › home page shows ready state (120ms)

  1 passed (872ms)

Mohd Shakir Zakaria is a cloud architect with deep roots in software development and open-source advocacy. Certified in AWS, Red Hat, VMware, ITIL, and Linux, he specializes in designing and managing robust cloud and on-premises infrastructures.


