How to record Playwright traces
Playwright traces preserve a browser test run as a replayable archive with action snapshots, console output, network requests, and source locations. Recording a trace for a focused failure gives the debugging session a concrete artifact instead of only a terminal error.
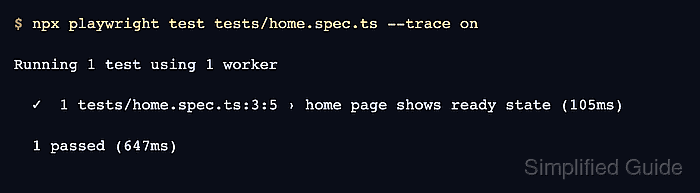
The Playwright Test runner can force trace recording for one local run with --trace on. The flag records and keeps a trace.zip for every selected test, regardless of the trace mode stored in playwright.config.ts.
Trace archives may include page content, screenshots, request data, and console messages from the application under test. Keep the selected file or browser project narrow when tracing locally, and store the resulting zip file as an internal artifact when it comes from CI or protected environments.
Related: How to view Playwright traces
Related: How to retain Playwright traces on failure
Related: How to debug Playwright tests
Steps to record Playwright traces:
- Open a terminal at the Playwright project root.
$ cd ~/projects/playwright-demo
The project root is the directory that owns playwright.config.ts or playwright.config.js.
- Run the target spec with trace recording forced on.
$ npx playwright test tests/home.spec.ts --trace on

Running 1 test using 1 worker

  ✓  1 tests/home.spec.ts:3:5 › home page shows ready state (105ms)

  1 passed (647ms)
--trace on records and keeps a trace for every test selected by the command. Use a file path, line number, --grep pattern, or --project selector when a full suite would generate too many archives.
Related: How to run specific Playwright tests - Locate the generated trace archive in the test output directory.
$ find test-results -name trace.zip
test-results/home-home-page-shows-ready-state/trace.zip
Playwright writes trace files under the configured output directory, which is usually test-results. Each selected test receives its own trace.zip inside that test's result folder.