How to run Playwright tests in UI mode
Playwright UI Mode turns a test project into an interactive browser dashboard for local iteration. It fits cases where a developer needs to rerun a focused spec, watch status change, and inspect run details without moving between terminal output and separate report files.
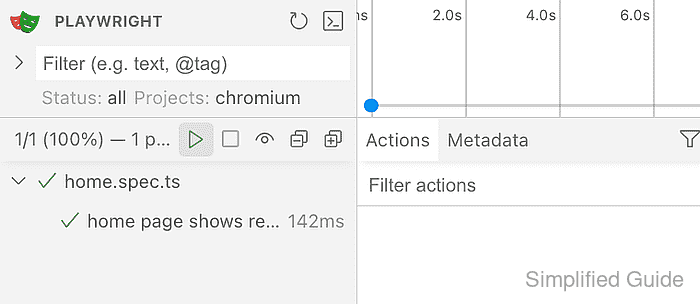
The dashboard is started by the Playwright Test runner from the project root, so it uses the same configuration, browser projects, fixtures, and test filters as a normal terminal run. Binding the UI to 127.0.0.1 with a fixed port makes the URL predictable while keeping the session local to the workstation.
UI Mode keeps serving until the terminal process is stopped. Traces, snapshots, console messages, and test data can be visible in the browser panel, so expose the UI on a wider network only when the port is intentionally protected in a container, codespace, or remote workspace.
Related: How to run Playwright tests
Related: How to run specific Playwright tests
Related: How to debug Playwright tests
Related: How to view Playwright traces
Steps to run Playwright tests in UI mode:
- Open a terminal at the Playwright project root.
$ cd ~/projects/playwright-demo
- List the target that should appear in the UI.
$ npx playwright test tests/home.spec.ts --project=chromium --list
Listing tests:
  [chromium] › home.spec.ts:3:5 › home page shows ready state
Total: 1 test in 1 file
Use the same file path, title filter, or --project value that should be loaded into UI Mode.
- Start UI Mode on a local fixed port.
$ npx playwright test tests/home.spec.ts --project=chromium --ui --ui-port=9323 --ui-host=127.0.0.1

Listening on http://127.0.0.1:9323
Omit the file path and --project option when the dashboard should load every discovered test.
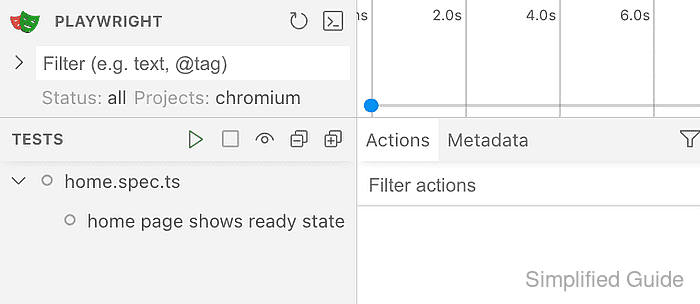
- Open the UI Mode URL in a browser and confirm the test list is visible.
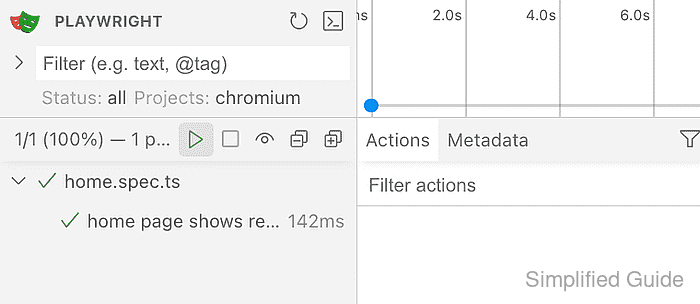
- Click the green run button beside TESTS and wait for the passed result.
- Stop UI Mode from the terminal with Ctrl+C when the browser session is finished.
Using --ui-host=0.0.0.0 can expose traces, snapshots, passwords, and other test data to machines that can reach the port.