How to check NFS server performance
Slow file access over NFS can originate on a busy client, a noisy network path, the server's kernel nfsd threads, or the backing filesystem. Sampling server-side counters during the affected period gives the administrator a local view of request volume, malformed calls, byte movement, duplicate requests, and stale file-handle signals before changing exports or thread counts.
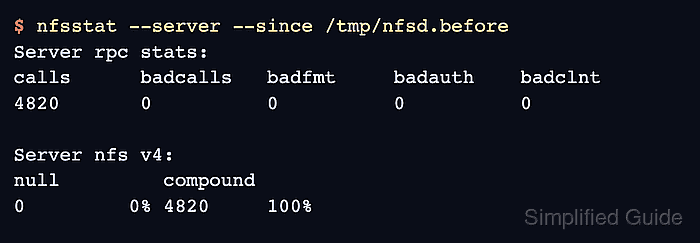
Linux nfs-utils reads server statistics from /proc/net/rpc/nfsd. Saving that raw counter file before the suspect workload and comparing it afterward with nfsstat keeps the sample tied to the incident window instead of mixing it with counters accumulated since boot.
Server-side counters come from the host that owns the exports. Clean values there do not clear a client, switch, firewall, or storage device by themselves, but they show whether that host handled requests, saw bad RPC calls, moved bytes, reused reply-cache entries, or reported stale file handles during the same window a client was slow.
Steps to check NFS server performance:
- Open a shell on the NFS server with an account that can use sudo.
- Confirm that the server unit is active before sampling counters.
$ sudo systemctl is-active nfs-server
active
On current Ubuntu and Debian packages, nfs-kernel-server may also appear as a service or package alias. Use the detailed status check when the unit is inactive, failed, or missing.
- Check how many kernel nfsd threads are running.
$ cat /proc/fs/nfsd/threads
16
The thread count is capacity, not a utilization percentage. Record it with the sample so later tuning changes have a before value.
- Save a baseline of the raw server counters before the workload window.
$ cp /proc/net/rpc/nfsd /tmp/nfsd.before
Use a task-specific filename if several administrators are sampling the same server. The file contains counters only; it does not include file data or client credentials.
- Keep the affected client workload running for the period you want to measure.
Use real application traffic when the slowdown is active. If no production workload is available, run a controlled client-side read or write against an export where temporary test data is allowed.
- Compare server RPC counters against the baseline.
$ nfsstat --server --since /tmp/nfsd.before
Server rpc stats:
calls      badcalls   badfmt     badauth    badclnt
4820       0          0          0          0

Server nfs v4:
null         compound
0         0% 4820    100%
calls should increase while clients access exports. badcalls, badfmt, badauth, and badclnt should stay at zero during a clean sample. If the affected client is active but calls stays at zero, check the client mount, firewall path, server address, and export visibility before changing server performance settings.
- Inspect server packet, I/O, reply-cache, read-ahead, and file-handle counters for the same sample.
$ nfsstat --server -o all --since /tmp/nfsd.before
Server packet stats:
packets    udp        tcp        tcpconn
4820       0          4820       24

Server rpc stats:
calls      badcalls   badfmt     badauth    badclnt
4820       0          0          0          0

Server reply cache:
hits       misses     nocache
12         4808       0

Server io stats:
read       write
73400320   25165824

##### snipped #####

Server file handle cache:
lookup     anon       ncachedir  ncachenondir  stale
9362       0          2140       7222          0
io shows bytes read and written by the server, reply cache hits can indicate duplicate RPC requests, and stale file-handle entries point to clients using handles that no longer match the exported filesystem state.
- Review kernel warnings from the same time window.
$ sudo journalctl --kernel --priority=warning..alert --since "10 minutes ago"
-- No entries --
No entries for the sample window means the kernel journal did not record warning-level storage, network, or nfsd messages during that query. If warnings appear, match their timestamps to the counter sample before treating the counters as normal load.
- Remove the temporary counter baseline.
$ rm -f /tmp/nfsd.before