NFS client performance checks show what the Linux client sees while an application reads from or writes to a mounted export. nfsiostat reports the per-mount request rate, throughput, retransmissions, RPC round-trip time, execution time, queue delay, and errors that are otherwise hidden behind a slow file operation.
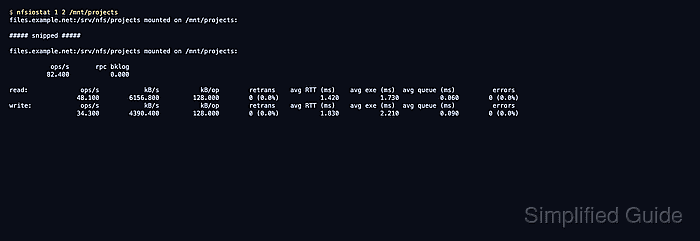
nfsiostat reads /proc/self/mountstats, so it only reports mounted NFS filesystems from the client namespace where it runs. Sampling one mount point keeps the output tied to the export that users are complaining about instead of mixing unrelated home, archive, or backup mounts into the same report.
Use the interval form while the workload is active. The first report is cumulative since the export was mounted, while later reports show activity during each sample interval; those later reports are the ones to use when deciding whether the current slowdown points to the client queue, the network path, or the server side.
Steps to check NFS client performance with nfsiostat:
- Open a terminal on the Linux client that has the slow export mounted.
- Confirm that the target path is an NFS mount.
$ findmnt --types nfs,nfs4 --target /mnt/projects --output TARGET,SOURCE,FSTYPE,OPTIONS
TARGET        SOURCE                              FSTYPE OPTIONS
/mnt/projects files.example.net:/srv/nfs/projects nfs4   rw,relatime,vers=4.2,rsize=1048576,wsize=1048576,proto=tcp
Replace /mnt/projects with the mounted export path on the client. If findmnt returns no row, mount the export first because nfsiostat reports only mounted NFS filesystems.
Related: How to mount an NFS export on Linux
- Start a 5-second interval report for the target mount while the workload is active.
$ nfsiostat 5 3 /mnt/projects
files.example.net:/srv/nfs/projects mounted on /mnt/projects:

##### snipped #####

files.example.net:/srv/nfs/projects mounted on /mnt/projects:

           ops/s       rpc bklog
          82.400           0.000

read:              ops/s            kB/s           kB/op        retrans    avg RTT (ms)    avg exe (ms)  avg queue (ms)          errors
                  48.100        6156.800         128.000        0 (0.0%)           1.420           1.730           0.060        0 (0.0%)
write:             ops/s            kB/s           kB/op        retrans    avg RTT (ms)    avg exe (ms)  avg queue (ms)          errors
                  34.300        4390.400         128.000        0 (0.0%)           1.830           2.210           0.090        0 (0.0%)
The first block is cumulative since mount. Read a later interval block when checking current performance. If nfsiostat is missing, install the client utilities package first.
- Generate temporary write traffic from another terminal while the interval report is running only when no real workload is available.
$ dd if=/dev/zero of=/mnt/projects/nfsiostat-test.bin bs=1M count=128 conv=fdatasync
128+0 records in
128+0 records out
134217728 bytes (134 MB, 128 MiB) copied, 2.3 s, 58.4 MB/s
Use a controlled test only on an export where a temporary file is acceptable. For production incidents, sample the real application workload instead of creating extra write load.
- Check the read and write rows in the interval report that printed after the workload started.
ops/s and kB/s show request rate and throughput, retrans and errors should remain at zero during a clean sample, avg RTT shows server and network response time, avg exe includes client-side completion time, and avg queue shows delay before the request leaves the client.
- Treat retransmissions, errors, or split latency as the next investigation path.
Repeated retransmissions or errors during a short sample are failure signals. High avg RTT points toward the server or network path, while high avg exe with lower avg RTT points toward client-side wait or queueing.
- Remove the temporary test file if the controlled workload step created one.
$ rm -f /mnt/projects/nfsiostat-test.bin

Mohd Shakir Zakaria is a cloud architect with deep roots in software development and open-source advocacy. Certified in AWS, Red Hat, VMware, ITIL, and Linux, he specializes in designing and managing robust cloud and on-premises infrastructures.


