How to collect network evidence during incident triage
Network evidence during incident triage is volatile because sockets close, DNS answers expire, and short packet bursts disappear before a responder can rebuild the timeline. A bounded first pass on the affected Linux host preserves the live endpoints, route choice, resolver answer, and packet sample that explain what the host was trying to reach.
Keep the collection narrow enough for the incident scope. An evidence note should name the host, suspected peer, resolver, interface, capture window, and evidence location before packets are captured, so later reviewers can separate approved evidence from unrelated user traffic.
Packet captures and socket tables can expose internal addresses, hostnames, process names, and payload fragments. Store raw files in the incident evidence location, hash the files before handoff, and publish only sanitized summaries outside the response team.
Steps to collect network evidence during incident triage:
- Record the incident scope in the evidence notes.
Incident: INC-2026-0627-014
Affected host: workstation-07.example.net
Suspect peer: 203.0.113.45
Suspect DNS name: beacon-01.example.net
Resolver: 192.0.2.53
Capture window: 2026-06-27 09:10-09:20 UTC
Evidence directory: /secure/incidents/INC-2026-0627-014/network
Do not expand the capture to unrelated subnets, users, or ports without incident-owner approval. Broad packet captures can collect credentials, session cookies, private hostnames, and unrelated user traffic.
- Capture current sockets and listening ports from the affected host.
$ sudo ss --tcp --udp --all --numeric --processes
Netid State     Recv-Q Send-Q Local Address:Port    Peer Address:Port Process
tcp   ESTAB     0      0      192.0.2.40:53816     203.0.113.45:443 users:(("browser",pid=1842,fd=91))
tcp   LISTEN    0      4096   0.0.0.0:22          0.0.0.0:*       users:(("sshd",pid=716,fd=3))
udp   UNCONN    0      0      192.0.2.40:5353     0.0.0.0:*       users:(("systemd-resolve",pid=508,fd=15))
--all includes listening and non-listening sockets, --numeric keeps addresses and ports unmodified, and --processes records the owning process when permissions allow it. TIME-WAIT rows often have no process because the application has already closed the socket.
Related: How to show socket summary with ss - Identify the route and capture interface for the suspected peer.
$ ip route get 203.0.113.45
203.0.113.45 via 192.0.2.1 dev eth0 src 192.0.2.40 uid 1000
    cache
The dev value is the first capture interface candidate, and the src value is the local address to match against packet, firewall, proxy, and resolver logs.
Related: How to select a capture interface in tcpdump - Query the resolver named in the incident scope.
$ dig @192.0.2.53 beacon-01.example.net A +noall +comments +answer
;; Got answer:
;; ->>HEADER<<- opcode: QUERY, status: NOERROR, id: 49261
;; flags: qr rd ra; QUERY: 1, ANSWER: 1, AUTHORITY: 0, ADDITIONAL: 1

;; ANSWER SECTION:
beacon-01.example.net. 60 IN A 203.0.113.45
Query the same resolver and record type from the alert when possible. NOERROR with an answer means the resolver can still return destination data; NXDOMAIN, SERVFAIL, or no answer changes the next evidence source.
- Run a short live capture on the selected interface.
$ sudo tcpdump --interface=eth0 -nn -c 6 'host 203.0.113.45 or host 192.0.2.53'
tcpdump: verbose output suppressed, use -v[v]... for full protocol decode
listening on eth0, link-type EN10MB (Ethernet), snapshot length 262144 bytes
09:12:41.183421 IP 192.0.2.40.53582 > 192.0.2.53.53: 38174+ A? beacon-01.example.net. (39)
09:12:41.196908 IP 192.0.2.53.53 > 192.0.2.40.53582: 38174 1/0/0 A 203.0.113.45 (55)
09:12:42.012447 IP 192.0.2.40.53816 > 203.0.113.45.443: Flags [S], seq 3661777421, win 64240, length 0
##### snipped #####
6 packets captured
6 packets received by filter
0 packets dropped by kernel
The filter keeps the first capture tied to the suspected peer and resolver. A non-zero dropped by kernel count means the capture may have missed packets and should be repeated with a smaller filter, shorter window, or less busy capture point.
- Save a full-packet capture for the approved incident window.
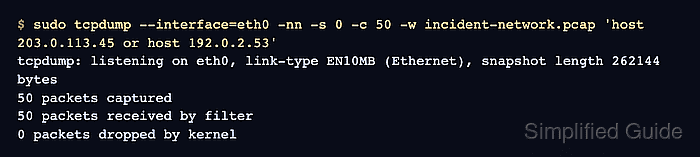
$ sudo tcpdump --interface=eth0 -nn -s 0 -c 50 -w incident-network.pcap 'host 203.0.113.45 or host 192.0.2.53'
tcpdump: listening on eth0, link-type EN10MB (Ethernet), snapshot length 262144 bytes
50 packets captured
50 packets received by filter
0 packets dropped by kernel
-s 0 keeps full packet contents. Treat the pcap as sensitive evidence even when the terminal summary looks harmless.
- Read the saved pcap before handoff.
$ tcpdump -nn -r incident-network.pcap
reading from file incident-network.pcap, link-type EN10MB (Ethernet), snapshot length 262144
09:12:41.183421 IP 192.0.2.40.53582 > 192.0.2.53.53: 38174+ A? beacon-01.example.net. (39)
09:12:41.196908 IP 192.0.2.53.53 > 192.0.2.40.53582: 38174 1/0/0 A 203.0.113.45 (55)
09:12:42.012447 IP 192.0.2.40.53816 > 203.0.113.45.443: Flags [S], seq 3661777421, win 64240, length 0
##### snipped #####
Reading the pcap confirms that the file opens and contains the expected resolver and peer traffic before it leaves the host. Add packet payload review only when the incident owner approves exposing payload bytes.
Related: How to read a saved PCAP file using tcpdump - Hash the evidence files.
$ sha256sum incident-network.pcap incident-network-notes.txt
8b65114de0b65037f2c9a26e9e7a6da8b4f7d3bc6e1435ce2f337ba3e11df94d  incident-network.pcap
3a6de3819e6f96f8c07c99eb50724880a21f9e947af86aa3b57d80afcd665c5a  incident-network-notes.txt
Keep the checksum with the evidence record so a later analyst can confirm the pcap and notes were not replaced after triage.
- Write the network evidence summary for escalation.
Incident network evidence: INC-2026-0627-014
Affected host: workstation-07.example.net, source 192.0.2.40 on eth0
Suspect peer: 203.0.113.45 over TCP/443
Resolver evidence: beacon-01.example.net A returned 203.0.113.45 from 192.0.2.53
Socket evidence: browser process held an established TCP session to 203.0.113.45:443
Packet evidence: incident-network.pcap, 50 packets captured, 0 kernel drops
Integrity evidence: SHA256 hashes recorded for pcap and notes
Sharing boundary: raw pcap restricted to incident responders; external summary sanitized
Open endpoint process, proxy, firewall, or EDR evidence after the network bundle identifies the source process, route, resolver answer, and packet sample.