How to enable OpenTelemetry tracing in LlamaIndex
A LlamaIndex request can cross document parsing, embedding, retrieval, prompt construction, and model calls before returning one answer. OpenTelemetry exposes those internal stages as spans, making it possible to see where a query spent time and which component failed.
The llama-index-observability-otel package connects LlamaIndex instrumentation events to an OpenTelemetry tracer provider. A ConsoleSpanExporter keeps the first test local, while a simple span processor prints each completed span immediately instead of waiting for a batch.
Span events can contain queries, retrieved text, prompts, model responses, and embeddings. Use non-sensitive sample content for the console test, then apply suitable retention and access controls before sending production traces to a collector or hosted backend.
Steps to enable LlamaIndex OpenTelemetry tracing:
- Install the LlamaIndex core and OpenTelemetry observability packages in the active Python environment.
$ python -m pip install --upgrade llama-index-core llama-index-observability-otel
The project's existing virtual environment keeps these dependencies isolated from the system Python installation.
Related: How to install LlamaIndex with pip - Create trace_llamaindex.py with the imports and deterministic test models.
- trace_llamaindex.py
from llama_index.core import Document, Settings, VectorStoreIndex
from llama_index.core.embeddings import MockEmbedding
from llama_index.core.llms.mock import MockLLM
from llama_index.observability.otel import LlamaIndexOpenTelemetry
from opentelemetry.sdk.trace.export import ConsoleSpanExporter

Settings.embed_model = MockEmbedding(embed_dim=8)
Settings.llm = MockLLM(max_tokens=16)
- Add the OpenTelemetry registration below the Settings assignments.
instrumentor = LlamaIndexOpenTelemetry(
    service_name_or_resource="llamaindex-demo",
    span_exporter=ConsoleSpanExporter(),
    span_processor="simple",
)
instrumentor.start_registering()
Instrumentation sees events emitted after registration, so this block belongs before index, query engine, agent, or workflow construction. The simple processor suits this terminal smoke test; long-running applications normally use batching and an OTLP exporter.
- Add the index-backed retrieval workflow after start_registering().
index = VectorStoreIndex.from_documents(
    [Document(text="OpenTelemetry exports LlamaIndex retrieval and query spans.")]
)
query_engine = index.as_query_engine(similarity_top_k=1)
response = query_engine.query("What does OpenTelemetry export?")

print("Answer:", response)
- Review the completed trace_llamaindex.py file before execution.
- trace_llamaindex.py
from llama_index.core import Document, Settings, VectorStoreIndex
from llama_index.core.embeddings import MockEmbedding
from llama_index.core.llms.mock import MockLLM
from llama_index.observability.otel import LlamaIndexOpenTelemetry
from opentelemetry.sdk.trace.export import ConsoleSpanExporter

Settings.embed_model = MockEmbedding(embed_dim=8)
Settings.llm = MockLLM(max_tokens=16)

instrumentor = LlamaIndexOpenTelemetry(
    service_name_or_resource="llamaindex-demo",
    span_exporter=ConsoleSpanExporter(),
    span_processor="simple",
)
instrumentor.start_registering()

index = VectorStoreIndex.from_documents(
    [Document(text="OpenTelemetry exports LlamaIndex retrieval and query spans.")]
)
query_engine = index.as_query_engine(similarity_top_k=1)
response = query_engine.query("What does OpenTelemetry export?")

print("Answer:", response)
- Run the instrumented query from the directory containing trace_llamaindex.py.
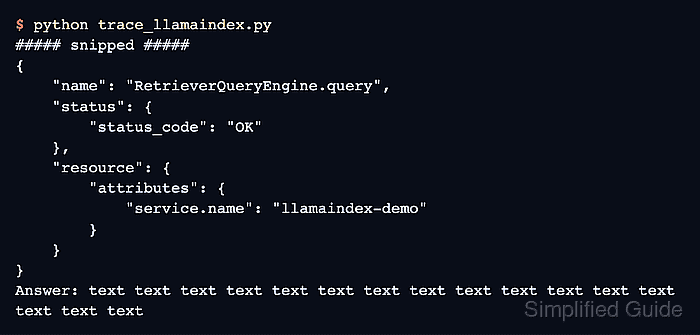
$ python trace_llamaindex.py ##### snipped ##### { "name": "RetrieverQueryEngine.query", "context": { ##### snipped ##### }, "status": { "status_code": "OK" }, ##### snipped ##### "resource": { "attributes": { "service.name": "llamaindex-demo" }, "schema_url": "" } } Answer: text text text text text text text text text text text text text text text text - Confirm the output includes a RetrieverQueryEngine.query span with status_code set to OK and service.name set to llamaindex-demo.
Console spans can expose query text, document chunks, prompts, model output, and embeddings. Real application data does not belong in terminal captures, issue trackers, or shared logs.