How to enable llama.cpp server metrics
Monitoring a local llama.cpp server is easier when inference counters come from the server process instead of from a proxy, wrapper script, or client log. llama-server can expose Prometheus-compatible metrics so an operator can see prompt tokens, generated tokens, request activity, and throughput from the same listener that handles model requests.
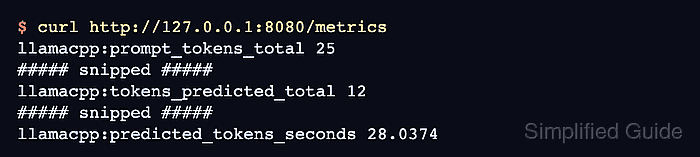
The metrics endpoint is disabled by default and turns on when llama-server starts with --metrics. The endpoint lives at /metrics on the configured host and port, and it returns plain text in the Prometheus exposition format.
Use the same server process that handles normal inference traffic when testing the endpoint. Counters can appear at zero immediately after startup, so a small completion request gives a clearer proof that the endpoint is measuring the loaded model rather than only serving a static page.
Related: Start the llama.cpp server
Related: Check llama.cpp server health
Related: Call the llama.cpp chat completions API
Steps to enable llama.cpp server metrics:
- Start llama-server with the model path, an alias, and metrics enabled.
$ llama-server -m ./models/model.gguf --alias local-metrics --metrics
##### snipped #####
srv  llama_server: model loaded
srv  llama_server: listening on http://127.0.0.1:8080
Replace ./models/model.gguf with the GGUF model used by the server. Add --host and --port only when the listener should differ from the local default.
- Check that the server is ready before reading counters.
$ curl http://127.0.0.1:8080/health
{"status":"ok"}
A server that is still loading can return HTTP 503. Wait for /health to return ok before treating metrics as scrape-ready.
Related: How to check llama.cpp server health - Read the metrics endpoint before sending test traffic.
$ curl http://127.0.0.1:8080/metrics
# HELP llamacpp:prompt_tokens_total Number of prompt tokens processed.
# TYPE llamacpp:prompt_tokens_total counter
llamacpp:prompt_tokens_total 0
##### snipped #####
# HELP llamacpp:tokens_predicted_total Number of generation tokens processed.
# TYPE llamacpp:tokens_predicted_total counter
llamacpp:tokens_predicted_total 0
In router mode, request /metrics?model=MODEL_ID for the model being scraped. The plain /metrics path is the single-model form.
- Send a small completion request through the same server.
$ curl --request POST http://127.0.0.1:8080/completion \
  --header 'Content-Type: application/json' \
  --data '{"prompt":"Write one short sentence about monitoring.","n_predict":12,"temperature":0.2,"seed":42}'
{
  "content": "When she got to the park",
  "model": "local-metrics",
  "tokens_predicted": 12,
  "tokens_evaluated": 25
}
The generated text varies by model and prompt. The token fields are the important smoke-test evidence for the later counter check.
- Confirm that the metrics counters changed after the completion request.
$ curl http://127.0.0.1:8080/metrics
# HELP llamacpp:prompt_tokens_total Number of prompt tokens processed.
# TYPE llamacpp:prompt_tokens_total counter
llamacpp:prompt_tokens_total 25
##### snipped #####
# HELP llamacpp:tokens_predicted_total Number of generation tokens processed.
# TYPE llamacpp:tokens_predicted_total counter
llamacpp:tokens_predicted_total 12
##### snipped #####
llamacpp:predicted_tokens_seconds 28.0374
The endpoint is ready for a Prometheus scrape when token counters and throughput gauges move after a real request.