How to create a REST API load test in JMeter
REST API load testing has to prove that virtual users send the same method, headers, and JSON body that a real client sends. In JMeter, that means building the API request as an HTTP Request sampler, adding request metadata at the right scope, and failing the sample when the response JSON no longer matches the contract.
A small validation run should come before raising load. Start with a Thread Group that sends only a few requests, keep the endpoint pointed at a safe test API, and save the result file so failed assertions, response codes, and dashboard totals can be checked outside the GUI.
The sample plan posts a JSON checkout order to a neutral endpoint, checks that the response contains an accepted status, and generates an HTML dashboard. Replace api.example.test, the path, and the payload with a non-production target owned by the test run before increasing users or duration.
Steps to create a JMeter REST API load test:
- Open the JMeter GUI and create a new test plan.
- Name the test plan for the API scenario.
Name: REST API load test
- Add a Thread Group under the test plan.
Name: Checkout API users
Number of Threads (users): 2
Ramp-up period (seconds): 1
Loop Count: 2
Keep the first validation run small. Increase users, loops, or duration only after the JSON assertion and result file show passing samples.
Related: How to configure a thread group in JMeter - Add an HTTP Header Manager under the Thread Group.
Name: API JSON headers

Name: Content-Type
Value: application/json

Name: Accept
Value: application/json

Name: X-Test-Scenario
Value: checkout-smoke
Do not save live bearer tokens, API keys, session cookies, or private customer values as literal header rows in a shared .jmx file. Load secrets from variables or command-line properties.
Related: How to add HTTP headers in JMeter - Preflight the request shape when the target endpoint is browser-visible.
Method: POST
URL: http://api.example.test:18080/orders
Content-Type: application/json
Body: {"sku":"BK-204","quantity":2}
Skip browser preflight for private APIs that require server-side credentials or block CORS reads; use the service's normal smoke-test client instead.
Tool: Application Programming Interface (API) Testing Tool - Add an HTTP Request sampler under the same Thread Group.
Name: POST /orders
Protocol: http
Server Name or IP: api.example.test
Port Number: 18080
Method: POST
Path: /orders
Body Data: {"sku":"BK-204","quantity":2}
Use a read-only, disposable, or explicitly approved test endpoint. A load test against a production write path can create real orders, tickets, messages, or charges if the API is not isolated.
- Add a JSON Assertion under POST /orders.
Name: JSON status is accepted
Assert JSON Path exists: $.status
Additionally assert value: selected
Expected Value: accepted
Match as regular expression: cleared
Expect null: cleared
Invert assertion: cleared
The assertion makes a bad JSON value fail the sampler even when the HTTP status is 200.
Related: How to add a JSON assertion in JMeter - Save the test plan.
rest-api-load-test.jmx
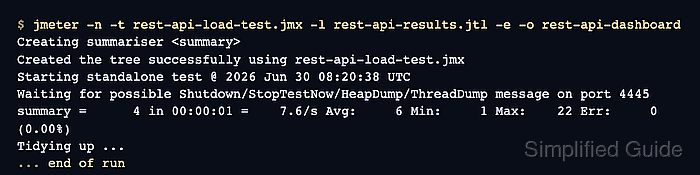
- Run the test plan in non-GUI mode and generate the dashboard.
$ jmeter -n -t rest-api-load-test.jmx -l rest-api-results.jtl -e -o rest-api-dashboard
Creating summariser <summary>
Created the tree successfully using rest-api-load-test.jmx
Starting standalone test @ 2026 Jun 30 08:20:38 UTC
Waiting for possible Shutdown/StopTestNow/HeapDump/ThreadDump message on port 4445
summary =      4 in 00:00:01 =    7.6/s Avg:     6 Min:     1 Max:    22 Err:     0 (0.00%)
Tidying up ...
... end of run
-n selects non-GUI mode, -t points at the saved plan, -l writes the .jtl result file, -e enables report generation, and -o names the dashboard directory.
Related: How to run a JMeter test from the command line
Related: How to generate an HTML dashboard report in JMeter - Check the result file for successful samples.
$ cat rest-api-results.jtl
timeStamp,elapsed,label,responseCode,responseMessage,threadName,dataType,success,failureMessage,bytes,sentBytes,grpThreads,allThreads,URL,Latency,IdleTime,Connect
1782807638800,22,POST /orders,200,OK,Checkout API users 1-1,text,true,,214,272,1,1,http://api.example.test:18080/orders,18,0,15
1782807638844,1,POST /orders,200,OK,Checkout API users 1-1,text,true,,214,272,1,1,http://api.example.test:18080/orders,1,0,0
1782807639232,1,POST /orders,200,OK,Checkout API users 1-2,text,true,,214,272,1,1,http://api.example.test:18080/orders,1,0,0
1782807639233,1,POST /orders,200,OK,Checkout API users 1-2,text,true,,214,272,1,1,http://api.example.test:18080/orders,1,0,1
The success column should show true for every REST sampler before the user count, loop count, or duration is raised.
- Check the API server log or request inspector for the received request.
$ cat rest-api-server.log
server=listening host=api.example.test port=18080
request method=POST path=/orders content_type=application/json accept=application/json scenario=checkout-smoke body={"sku":"BK-204","quantity":2} status=200
request method=POST path=/orders content_type=application/json accept=application/json scenario=checkout-smoke body={"sku":"BK-204","quantity":2} status=200
request method=POST path=/orders content_type=application/json accept=application/json scenario=checkout-smoke body={"sku":"BK-204","quantity":2} status=200
request method=POST path=/orders content_type=application/json accept=application/json scenario=checkout-smoke body={"sku":"BK-204","quantity":2} status=200
The server-side evidence should show the expected method, path, content type, accepted media type, scenario header, and JSON body.
- Check the dashboard statistics for sample and error totals.
$ cat rest-api-dashboard/statistics.json
{
  "POST /orders" : {
    "transaction" : "POST /orders",
    "sampleCount" : 4,
    "errorCount" : 0,
    "errorPct" : 0.0,
    "meanResTime" : 6.25,
##### snipped #####
  },
  "Total" : {
    "transaction" : "Total",
    "sampleCount" : 4,
    "errorCount" : 0,
    "errorPct" : 0.0,
    "meanResTime" : 6.25,
##### snipped #####
  }
}
Open rest-api-dashboard/index.html for charts after the Total row shows the expected sample count and error count.