How to change JMeter log levels
The JMeter run log is the right place to look when a sampler, script, plugin, or remote engine fails before the result file explains enough. Raising one logger category for a short diagnostic run exposes lower-level messages without turning the whole load engine into noisy output.
JMeter accepts temporary logging overrides from the command line with -L[category]=[priority]. Pair the override with -j so the diagnostic run writes to a dedicated jmeter.log file instead of mixing troubleshooting output into a previous run log.
Use full logger category names when possible, and target the component that matches the failing sampler, script, plugin, or engine layer. Remove the -L option after the capture, or lower the category back to INFO, because DEBUG logging can produce large logs and slow longer load runs.
Steps to change JMeter log levels for a diagnostic run:
- Choose the logger category and diagnostic log file for the run.
Test plan: log-level-demo.jmx
Result file: results/debug.jtl
Run log: results/debug.log
Logger category: org.apache.jmeter.protocol.java.sampler.JSR223Sampler
Level: DEBUG
Use the narrowest category that matches the failing component. Use root-level -LDEBUG only for a very short reproduction, because it enables debug output across many JMeter subsystems.
- Run the test plan with the temporary log-level override.
$ jmeter -n \
  -t log-level-demo.jmx \
  -l results/debug.jtl \
  -j results/debug.log \
  -Lorg.apache.jmeter.protocol.java.sampler.JSR223Sampler=DEBUG
Creating summariser <summary>
Created the tree successfully using log-level-demo.jmx
Starting standalone test
summary =      1 in 00:00:00 =    3.2/s Avg:   293 Min:   293 Max:   293 Err:     0 (0.00%)
Tidying up ...
... end of run
-n runs without the GUI, -t names the plan, -l writes sample results, -j writes the run log, and -L changes the selected logger for this process.
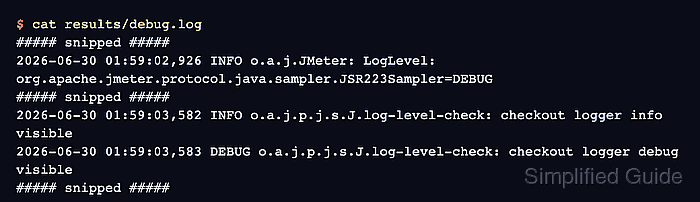
Related: How to run a JMeter test from the command line - Check the diagnostic run log for the applied category and the extra message.
$ cat results/debug.log
##### snipped #####
2026-06-30 01:59:02,926 INFO o.a.j.JMeter: LogLevel: org.apache.jmeter.protocol.java.sampler.JSR223Sampler=DEBUG
##### snipped #####
2026-06-30 01:59:03,582 INFO o.a.j.p.j.s.J.log-level-check: checkout logger info visible
2026-06-30 01:59:03,583 DEBUG o.a.j.p.j.s.J.log-level-check: checkout logger debug visible
##### snipped #####
The LogLevel line confirms that JMeter accepted the override. The DEBUG line confirms that the selected logger emitted lower-level output during the run.
- Confirm that the diagnostic run still completed successfully.
$ cat results/debug.jtl
timeStamp,elapsed,label,responseCode,responseMessage,threadName,dataType,success,failureMessage,bytes,sentBytes,grpThreads,allThreads,URL,Latency,IdleTime,Connect
1782784743295,293,log-level-check,200,OK,Log Check Thread Group 1-1,text,true,,22,0,1,1,null,0,0,0
The success column should still match the expected test outcome. Log-level changes should reveal troubleshooting detail, not mask sampler or assertion failures.
- Run the same plan again without the temporary DEBUG override.
$ jmeter -n -t log-level-demo.jmx -l results/reset.jtl -j results/reset.log
Creating summariser <summary>
Created the tree successfully using log-level-demo.jmx
Starting standalone test
summary =      1 in 00:00:00 =    3.1/s Avg:   299 Min:   299 Max:   299 Err:     0 (0.00%)
Tidying up ...
... end of run
Do not leave broad DEBUG logging enabled for a load window. Large run logs can grow quickly and add avoidable client-side overhead.
- Check the normal run log for ordinary INFO output only.
$ cat results/reset.log
##### snipped #####
2026-06-30 02:00:26,148 INFO o.a.j.p.j.s.J.log-level-check: checkout logger info visible
##### snipped #####
The absence of the diagnostic DEBUG line confirms that the temporary command-line override is no longer active for the normal run.