How to set the Kibana server host
Setting the Kibana server host controls which local network interfaces accept browser and API traffic. Package installs default to a loopback listener, so remote users, reverse proxies, or load balancers cannot reach Kibana until the listener is moved to a non-loopback address.
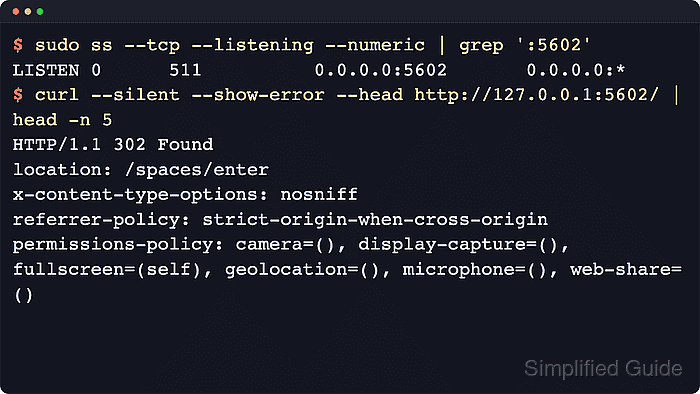
Self-managed Kibana reads server.host from kibana.yml when the process starts. Package, archive, and custom service layouts can place that file in different config directories, so verify the active file before editing instead of changing a stale copy.
Use the all-address listener only when every local interface should accept Kibana traffic and firewall rules already define who may connect. A specific private address limits the listener to one interface, while server.port continues to control the TCP port separately.
Related: How to set the Kibana public base URL
Related: How to configure the Kibana base path
Tool: Port Exposure Summary Checker
Steps to set the Kibana server host:
- Back up the packaged Kibana configuration file.
$ sudo cp /etc/kibana/kibana.yml /etc/kibana/kibana.yml.bak
Debian and RPM packages use /etc/kibana/kibana.yml by default. Use the kibana.yml file under KBN_PATH_CONF instead when the service is configured with a custom config directory.
- Open the Kibana configuration file in a root-owned editor.
$ sudoedit /etc/kibana/kibana.yml
Archive installs commonly use /usr/share/kibana/config/kibana.yml instead of /etc/kibana/kibana.yml.
- Set server.host to the address that should accept Kibana connections.
server.host: "0.0.0.0"
Use localhost to keep Kibana local-only, or a specific private IP such as 192.0.2.15 when only one interface should listen.
0.0.0.0 binds Kibana to all public and private IPs on the host. Confirm firewall, security group, or reverse proxy controls before exposing the listener.
- Restart the Kibana service to load the listener change.
$ sudo systemctl restart kibana.service
- Confirm Kibana is listening on the configured port and address.
$ sudo ss --tcp --listening --numeric 'sport = :5601'
State  Recv-Q Send-Q Local Address:Port Peer Address:Port
LISTEN 0      511          0.0.0.0:5601      0.0.0.0:*
If server.port uses a non-default value, replace 5601 with that port. If server.host uses one private address, the local address column should show that address instead of 0.0.0.0.
- Request Kibana from an allowed client or reverse proxy host.
$ curl --silent --show-error --output /dev/null --write-out "%{http_code}\n" http://kibana.example.net:5601/
302
A 200, 302, 401, or 503 response proves that the listener is reachable. Use the status API when the listener answers but Kibana is not ready for users.
Related: How to check Kibana status