How to create a Kibana data view for Logstash indices
A Kibana data view is what makes Logstash output usable in Discover, Lens, dashboards, and alerts. Creating a view that matches the indices your pipeline actually writes keeps queries scoped to the right documents and avoids confusing empty searches or missing time filters.
A data view (formerly an index pattern) is a Kibana saved object that stores the source pattern and field metadata Kibana should use. For Logstash pipelines in index mode, the pattern is often logstash-*; when ECS-compatible templates are enabled it is often ecs-logstash-*; and the same API can also target aliases or data streams.
Creating or saving the data view requires the Data View Management Kibana privilege plus the view_index_metadata Elasticsearch privilege on the matching indices. If your Logstash pipeline uses a custom index => pattern or writes to data streams, substitute that exact target name in the commands below, and prefix the Kibana path with /s/<space_id> when the data view belongs to a non-default space.
Related: How to create a Kibana data view
Related: How to delete a Kibana data view
Steps to create a Kibana data view for Logstash indices:
- Confirm which Logstash index pattern is currently present in Elasticsearch.
$ curl --silent --show-error --fail --cacert /etc/elasticsearch/certs/http-ca.crt --user elastic:password "https://localhost:9200/_cat/indices/logstash-*?h=index,docs.count"
logstash-2026.04.01 9134
logstash-2026.04.02   28
Replace logstash-* with the actual output target from the Logstash pipeline. Current elasticsearch output defaults are typically logstash-* or ecs-logstash-* for index mode, while data-stream mode commonly routes to names such as logs-generic-default.
- Confirm the intended time field is mapped as a date in the matching Logstash indices.
$ curl --silent --show-error --fail --cacert /etc/elasticsearch/certs/http-ca.crt --user elastic:password "https://localhost:9200/logstash-*/_field_caps?fields=@timestamp" | jq '{indices: .indices, field: .fields["@timestamp"].date}'
{
  "indices": [
    "logstash-2026.04.01",
    "logstash-2026.04.02"
  ],
  "field": {
    "type": "date",
    "metadata_field": false,
    "searchable": true,
    "aggregatable": true
  }
}
If the pipeline uses a different event time field, use that field name here and in timeFieldName during creation.
- Create the data view for the Logstash index pattern.
$ curl --silent --show-error --fail --cacert /etc/kibana/certs/kibana-ca.crt --user elastic:password --header "kbn-xsrf: true" --header "Content-Type: application/json" --request POST "https://localhost:5601/api/data_views/data_view" --data '{
  "data_view": {
    "title": "logstash-*",
    "name": "Logstash indices",
    "timeFieldName": "@timestamp"
  }
}' | jq '{data_view: {id: .data_view.id, name: .data_view.name, title: .data_view.title, timeFieldName: .data_view.timeFieldName, allowNoIndex: .data_view.allowNoIndex}}'
{
  "data_view": {
    "id": "c8e91240-f0ef-11ee-a6d9-e546fe2bba5f",
    "name": "Logstash indices",
    "title": "logstash-*",
    "timeFieldName": "@timestamp",
    "allowNoIndex": false
  }
}
Use https://localhost:5601/s/<space_id>/api/data_views/data_view for a non-default Kibana space.
Set allowNoIndex to true only when you intentionally want to save the data view before matching indices exist; leaving it at the default false catches pattern mistakes immediately.
A 403 response usually means the account is missing Data View Management in Kibana, view_index_metadata on the target indices, or both.
- Fetch the data view by id and confirm Kibana saved the expected pattern and time field.
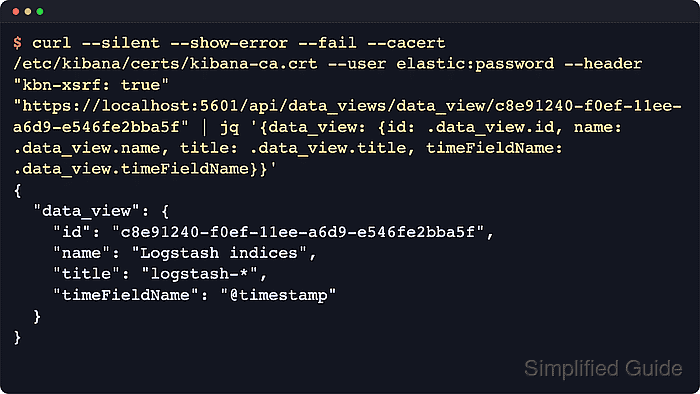
$ curl --silent --show-error --fail --cacert /etc/kibana/certs/kibana-ca.crt --user elastic:password --header "kbn-xsrf: true" "https://localhost:5601/api/data_views/data_view/c8e91240-f0ef-11ee-a6d9-e546fe2bba5f" | jq '{data_view: {id: .data_view.id, name: .data_view.name, title: .data_view.title, timeFieldName: .data_view.timeFieldName, namespaces: .data_view.namespaces}}'
{
  "data_view": {
    "id": "c8e91240-f0ef-11ee-a6d9-e546fe2bba5f",
    "name": "Logstash indices",
    "title": "logstash-*",
    "timeFieldName": "@timestamp",
    "namespaces": [
      "default"
    ]
  }
}
Matching title and timeFieldName confirm that Discover and other Kibana features can resolve the same Logstash data source through this saved object.
Related: How to delete a Kibana data view
- Open Discover and confirm the new data view appears in the data view selector.
If the selector is empty or the view opens with no fields, re-check the index pattern, the time field mapping, and the privileges on the Logstash indices.