Creating a Kibana data view saves the Elasticsearch target pattern that Discover, Lens, dashboards, and rules use when they need indexed data. A focused data view keeps users on the intended indices, aliases, or data streams instead of exposing unrelated sources in every data selector.
A data view is a Kibana saved object. The title stores the target pattern, and timeFieldName stores the field that the global time picker should use for time-based data. The target can be a single source, a wildcard pattern, a comma-separated list without spaces, or a cross-cluster pattern when the cluster is configured for remote search.
The Kibana API path fits deployment automation and saved-object recovery work where the same data view must be recreated repeatably. Creating or saving the object requires the Data View Management privilege in Kibana and the view_index_metadata privilege in Elasticsearch on the matching targets.
Related: How to delete a Kibana data view
Related: How to filter data in Kibana Discover
Related: How to create a Kibana Lens visualization
Steps to create a Kibana data view:
- Confirm the Elasticsearch target pattern matches the sources that Kibana should expose.
$ curl --silent --show-error --fail "http://localhost:9200/_resolve/index/app-logs-*?expand_wildcards=all"
{
  "indices": [
    {
      "name": "app-logs-000001",
      "attributes": [
        "open"
      ],
      "mode": "standard"
    }
  ],
  "aliases": [],
  "data_streams": []
}
Use the exact pattern the producer writes, such as filebeat-*, app-logs-*, an alias, a data stream name, or a comma-separated list without spaces. Set allowNoIndex in the create request only when the data view must exist before matching data arrives.
- Confirm the intended time field is mapped as a date or date_nanos field.
$ curl --silent --show-error --fail "http://localhost:9200/app-logs-*/_field_caps?fields=@timestamp"
{
  "indices": [
    "app-logs-000001"
  ],
  "fields": {
    "@timestamp": {
      "date": {
        "type": "date",
        "metadata_field": false,
        "searchable": true,
        "aggregatable": true
      }
    }
  }
}
If the source uses a different event-time field, use that field in this check and in timeFieldName. For non-time-based data, omit timeFieldName so the data view does not use the global time filter.
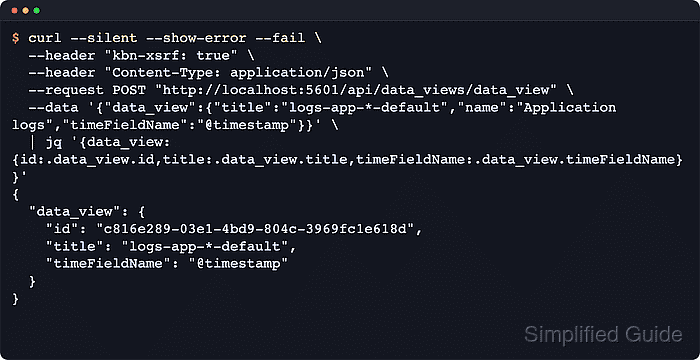
- Create the data view with the Kibana API.
$ curl --silent --show-error --fail \
  --header "kbn-xsrf: true" \
  --header "Content-Type: application/json" \
  --request POST "http://localhost:5601/api/data_views/data_view" \
  --data '{
    "data_view": {
      "title": "app-logs-*",
      "name": "Application logs",
      "timeFieldName": "@timestamp"
    }
  }'
{
  "data_view": {
    "id": "58d1fe89-f0b8-40c0-84d9-a6d64ecc0778",
    "name": "Application logs",
    "title": "app-logs-*",
    "timeFieldName": "@timestamp",
    "allowNoIndex": false,
##### snipped #####
    "namespaces": [
      "default"
    ]
  }
}
The kbn-xsrf header is required for non-GET Kibana API requests. Add /s/<space_id> before /api/data_views/data_view when the data view belongs to a non-default space.
Related: How to configure the Kibana base pathIf Kibana security or TLS is enabled, use the client-facing https:// URL and add an API key header or --user with the appropriate CA option.
- Fetch the data view by id and confirm Kibana saved the expected pattern and time field.
$ curl --silent --show-error --fail "http://localhost:5601/api/data_views/data_view/58d1fe89-f0b8-40c0-84d9-a6d64ecc0778"
{
  "data_view": {
    "id": "58d1fe89-f0b8-40c0-84d9-a6d64ecc0778",
    "name": "Application logs",
    "title": "app-logs-*",
    "timeFieldName": "@timestamp",
##### snipped #####
    "namespaces": [
      "default"
    ]
  }
}
Matching title and timeFieldName confirms that Kibana saved the data view that Discover and other apps will reference.
- Open Stack Management → Data Views and confirm Application logs appears with the app-logs-* pattern.
The same saved data view should also appear in Discover and Lens data-source selectors.
If the page shows a read-only indicator or the save action is missing, the account lacks the required Data View Management privilege in Kibana, the matching view_index_metadata privilege in Elasticsearch, or both.

Mohd Shakir Zakaria is a cloud architect with deep roots in software development and open-source advocacy. Certified in AWS, Red Hat, VMware, ITIL, and Linux, he specializes in designing and managing robust cloud and on-premises infrastructures.


